
- Home >
- Stock Videos >
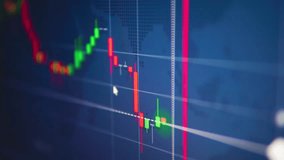
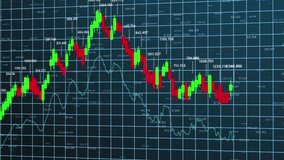
- Dynamic Financial Chart Analysis with Candlestick Bars
Dynamic Financial Chart Analysis with Candlestick Bars Video
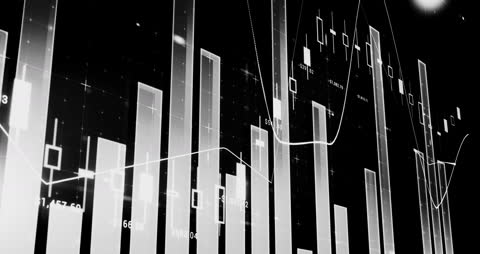
Dynamic visual of financial chart with candlestick bars, depicting data analysis for business and finance domains. Ideal for use in presentations, advertisements, or marketing campaigns focusing on financial growth and stock market influencs. This visual can highlight trend analysis and economic strategies.
Powered by  - Get 15% off with code: PIKWIZARD15


downloads
Tags:
More
Credit Photo
If you would like to credit the Photo, here are some ways you can do so
Text Link
video Link
<span class="text-link">
<span>
<a target="_blank" href=https://pikwizard.com/video/dynamic-financial-chart-analysis-with-candlestick-bars/bef2768637b92ac61a46bcdb04460f4b/>PikWizard</a>
</span>
</span>
<span class="image-link">
<span
style="margin: 0 0 20px 0; display: inline-block; vertical-align: middle; width: 100%;"
>
<a
target="_blank"
href="https://pikwizard.com/video/dynamic-financial-chart-analysis-with-candlestick-bars/bef2768637b92ac61a46bcdb04460f4b/"
style="text-decoration: none; font-size: 10px; margin: 0;"
>
<video controls style="width: 100%; margin: 0;">
<source src="https://player.vimeo.com/progressive_redirect/playback/767260187/rendition/240p/file.mp4?loc=external&oauth2_token_id=1223210874&signature=87a7d1936a1be6d551a30f893ec9e874ed047778e001ad7c9e57b27b197257ef" type="video/mp4"
poster="https://pikwizard.com/pw/medium/bef2768637b92ac61a46bcdb04460f4b.jpg"/>
Your browser does not support the video tag.
</video>
<p style="font-size: 12px; margin: 0;">PikWizard</p>
</a>
</span>
</span>
Free (free of charge)
Free for personal and commercial use.
Author: Awesome Content