
- Home >
- Stock Videos >
- Dynamic Financial Chart with Rising and Falling Indicators
Dynamic Financial Chart with Rising and Falling Indicators Video
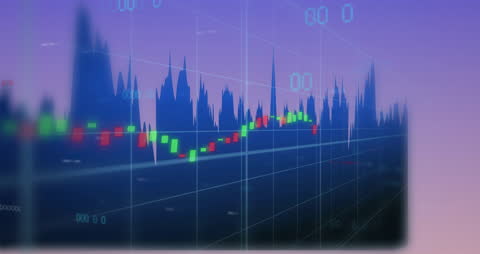
This digitally generated graphic showcases a dynamic financial chart, highlighting rising and falling indicators typically seen in economic and stock market analyses. It features vibrant colors and a digital grid, ideal for use in presentations or content related to finance, technology, or economic updates. Useful for illustrating trends in business or financial articles.
Powered by  - Get 15% off with code: PIKWIZARD15


downloads
Tags:
More
Credit Photo
If you would like to credit the Photo, here are some ways you can do so
Text Link
video Link
<span class="text-link">
<span>
<a target="_blank" href=https://pikwizard.com/video/dynamic-financial-chart-with-rising-and-falling-indicators/fe00edbb28d6d8371ba9997a6519bc91/>PikWizard</a>
</span>
</span>
<span class="image-link">
<span
style="margin: 0 0 20px 0; display: inline-block; vertical-align: middle; width: 100%;"
>
<a
target="_blank"
href="https://pikwizard.com/video/dynamic-financial-chart-with-rising-and-falling-indicators/fe00edbb28d6d8371ba9997a6519bc91/"
style="text-decoration: none; font-size: 10px; margin: 0;"
>
<video controls style="width: 100%; margin: 0;">
<source src="https://player.vimeo.com/progressive_redirect/playback/944652003/rendition/240p/file.mp4?loc=external&oauth2_token_id=1223210874&signature=06f28870dc695b53ddb58100c06ffa5648d127ff34bfa395243475857fa089af" type="video/mp4"
poster="https://pikwizard.com/pw/medium/fe00edbb28d6d8371ba9997a6519bc91.jpg"/>
Your browser does not support the video tag.
</video>
<p style="font-size: 12px; margin: 0;">PikWizard</p>
</a>
</span>
</span>
Free (free of charge)
Free for personal and commercial use.
Author: Awesome Content