
- Home >
- Stock Videos >
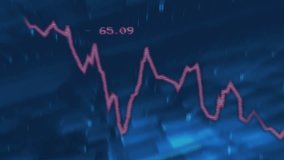
- Dynamic Financial Charts on Modern Digital Interface
Dynamic Financial Charts on Modern Digital Interface Video
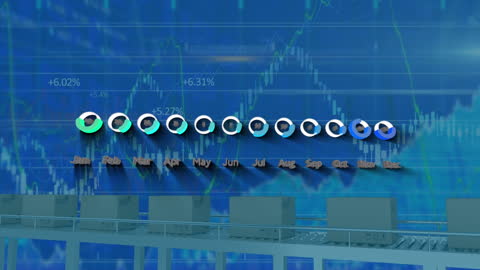
This visuals depict dynamic financial graphs moving against a blue digital interface, representing financial and economic statistics. Ideal for presentations on stock market analysis, economic trends, business strategy, and digital analytics tool demonstration.
Powered by  - Get 15% off with code: PIKWIZARD15


downloads
Tags:
More
Credit Photo
If you would like to credit the Photo, here are some ways you can do so
Text Link
video Link
<span class="text-link">
<span>
<a target="_blank" href=https://pikwizard.com/video/dynamic-financial-charts-on-modern-digital-interface/8260557eade0f9a0cab9f570419df320/>PikWizard</a>
</span>
</span>
<span class="image-link">
<span
style="margin: 0 0 20px 0; display: inline-block; vertical-align: middle; width: 100%;"
>
<a
target="_blank"
href="https://pikwizard.com/video/dynamic-financial-charts-on-modern-digital-interface/8260557eade0f9a0cab9f570419df320/"
style="text-decoration: none; font-size: 10px; margin: 0;"
>
<video controls style="width: 100%; margin: 0;">
<source src="https://player.vimeo.com/progressive_redirect/playback/732989364/rendition/240p/file.mp4?loc=external&oauth2_token_id=1223210874&signature=4e5879763f9cd185c44b5be1e2a14f7195808f12a986d64ccd9331f3b55572f3" type="video/mp4"
poster="https://pikwizard.com/pw/medium/8260557eade0f9a0cab9f570419df320.jpg"/>
Your browser does not support the video tag.
</video>
<p style="font-size: 12px; margin: 0;">PikWizard</p>
</a>
</span>
</span>
Free (free of charge)
Free for personal and commercial use.
Author: Awesome Content