
- Home >
- Stock Videos >
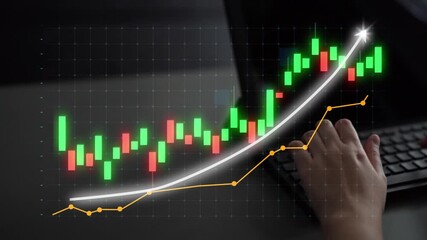
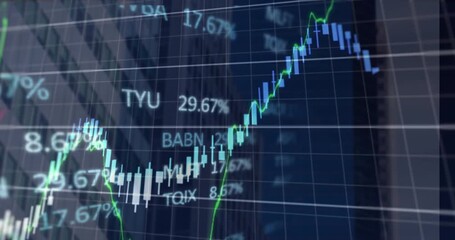
- Dynamic Financial Charts with Global Data Overlay
Dynamic Financial Charts with Global Data Overlay Video

This visualization captures animated financial charts with an array of data flowing dynamically. Trending graphs and numerical values present concepts of stock market analysis, economic forecasts, and business insights. Useful in presentations about market research, technological innovations in data visualization, and economic strategies.
Powered by 


downloads
Tags:
More
Credit Photo
If you would like to credit the Photo, here are some ways you can do so
Text Link
video Link
<span class="text-link">
<span>
<a target="_blank" href=https://pikwizard.com/video/dynamic-financial-charts-with-global-data-overlay/2e3d4640b4a0b98c80d89bbfecdf2c7b/>PikWizard</a>
</span>
</span>
<span class="image-link">
<span
style="margin: 0 0 20px 0; display: inline-block; vertical-align: middle; width: 100%;"
>
<a
target="_blank"
href="https://pikwizard.com/video/dynamic-financial-charts-with-global-data-overlay/2e3d4640b4a0b98c80d89bbfecdf2c7b/"
style="text-decoration: none; font-size: 10px; margin: 0;"
>
<video controls style="width: 100%; margin: 0;">
<source src="https://player.vimeo.com/progressive_redirect/playback/835751756/rendition/360p/file.mp4?loc=external&oauth2_token_id=1223210874&signature=40c4973e5450e9d4922e99198baf3e83c4dba6a9c2dc205a7d8dfcc2e157c1c4" type="video/mp4"
poster="https://pikwizard.com/pw/medium/2e3d4640b4a0b98c80d89bbfecdf2c7b.jpg"/>
Your browser does not support the video tag.
</video>
<p style="font-size: 12px; margin: 0;">PikWizard</p>
</a>
</span>
</span>
Free (free of charge)
Free for personal and commercial use.
Author: Awesome Content