
- Home >
- Stock Videos >
- Dynamic Financial Dashboard with Shifting Analytics Visuals
Dynamic Financial Dashboard with Shifting Analytics Visuals Video
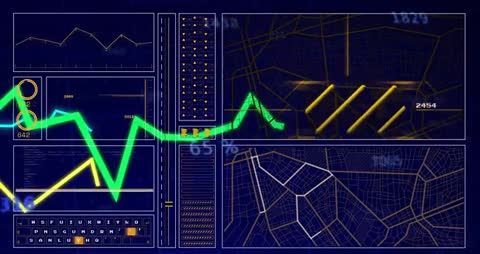
The video depicts real-time shifting financial data metrics with various graphs, charts, and digital maps illustrating fluctuating trends. Vibrant colors highlight changes over time aiding in visual data storytelling. This is ideal for projects focusing on finance analytics presentations, modern technology design showcases, and educational materials about data interpretation in economic studies.

downloads
Tags:
More
Credit Photo
If you would like to credit the Photo, here are some ways you can do so
Text Link
video Link
<span class="text-link">
<span>
<a target="_blank" href=https://pikwizard.com/video/dynamic-financial-dashboard-with-shifting-analytics-visuals/c8145a325dbef4d0a48ff3f9bdda3bad/>PikWizard</a>
</span>
</span>
<span class="image-link">
<span
style="margin: 0 0 20px 0; display: inline-block; vertical-align: middle; width: 100%;"
>
<a
target="_blank"
href="https://pikwizard.com/video/dynamic-financial-dashboard-with-shifting-analytics-visuals/c8145a325dbef4d0a48ff3f9bdda3bad/"
style="text-decoration: none; font-size: 10px; margin: 0;"
>
<video controls style="width: 100%; margin: 0;">
<source src="https://player.vimeo.com/progressive_redirect/playback/1124068345/rendition/240p/file.mp4?loc=external&oauth2_token_id=1223210874&signature=974113f4340b10b8a1a8bba115568779c0cce244744f7cda9f5b98b9460311ff" type="video/mp4"
poster="https://pikwizard.com/pw/medium/c8145a325dbef4d0a48ff3f9bdda3bad.jpg"/>
Your browser does not support the video tag.
</video>
<p style="font-size: 12px; margin: 0;">PikWizard</p>
</a>
</span>
</span>
Free (free of charge)
Free for personal and commercial use.
Author: Awesome Content