
- Home >
- Stock Videos >
- Dynamic Financial Data Analysis and Market Indicators
Dynamic Financial Data Analysis and Market Indicators Video
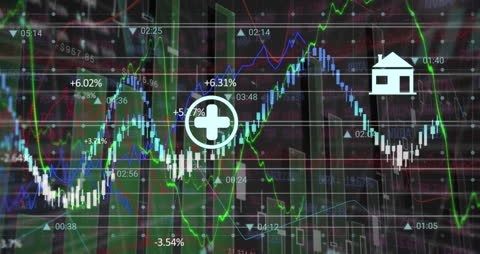
Image depicts vibrant financial data overlayed with graphs, indicators, and placeholders on digital background, showcasing concepts of market dynamics. Perfect for illustrating topics on finance, stock market ups and downs, trading strategies, and economic predictions.
Powered by 


downloads
Tags:
More
Credit Photo
If you would like to credit the Photo, here are some ways you can do so
Text Link
video Link
<span class="text-link">
<span>
<a target="_blank" href=https://pikwizard.com/video/dynamic-financial-data-analysis-and-market-indicators/dd9488fa8c522ccd04e1a0ae866055ff/>PikWizard</a>
</span>
</span>
<span class="image-link">
<span
style="margin: 0 0 20px 0; display: inline-block; vertical-align: middle; width: 100%;"
>
<a
target="_blank"
href="https://pikwizard.com/video/dynamic-financial-data-analysis-and-market-indicators/dd9488fa8c522ccd04e1a0ae866055ff/"
style="text-decoration: none; font-size: 10px; margin: 0;"
>
<video controls style="width: 100%; margin: 0;">
<source src="https://player.vimeo.com/progressive_redirect/playback/770297534/rendition/240p/file.mp4?loc=external&oauth2_token_id=1223210874&signature=635569908cbf5362538f75150d5d96c5970f4fa648826cb90aa423a46908374a" type="video/mp4"
poster="https://pikwizard.com/pw/medium/dd9488fa8c522ccd04e1a0ae866055ff.jpg"/>
Your browser does not support the video tag.
</video>
<p style="font-size: 12px; margin: 0;">PikWizard</p>
</a>
</span>
</span>
Free (free of charge)
Free for personal and commercial use.
Author: Awesome Content