
- Home >
- Stock Videos >
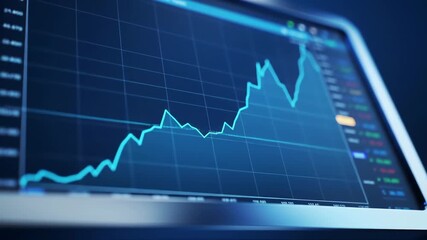
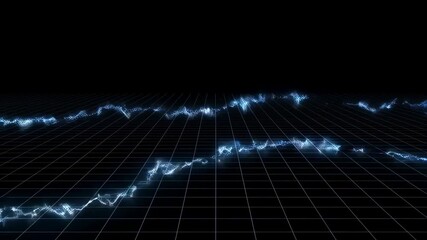
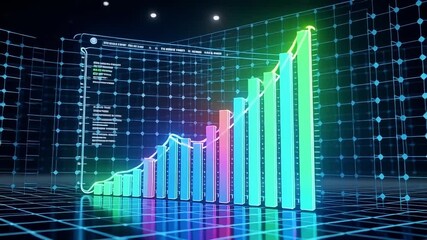
- Dynamic Financial Data Analysis and Market Trends Visualization
Dynamic Financial Data Analysis and Market Trends Visualization Video

This vibrant depiction of financial data dynamics showcases the processes involved in the global market, adding depth and focus to the concepts of analysis and trading, making it ideal for use in presentations about finance, economic reports, digital platforms focusing on market strategies, or educational materials engaging in business studies.
Powered by 


downloads
Tags:
More
Credit Photo
If you would like to credit the Photo, here are some ways you can do so
Text Link
video Link
<span class="text-link">
<span>
<a target="_blank" href=https://pikwizard.com/video/dynamic-financial-data-analysis-and-market-trends-visualization/fbf5fabf7ece1b4d21aed584b7ba6605/>PikWizard</a>
</span>
</span>
<span class="image-link">
<span
style="margin: 0 0 20px 0; display: inline-block; vertical-align: middle; width: 100%;"
>
<a
target="_blank"
href="https://pikwizard.com/video/dynamic-financial-data-analysis-and-market-trends-visualization/fbf5fabf7ece1b4d21aed584b7ba6605/"
style="text-decoration: none; font-size: 10px; margin: 0;"
>
<video controls style="width: 100%; margin: 0;">
<source src="https://player.vimeo.com/progressive_redirect/playback/770297469/rendition/240p/file.mp4?loc=external&oauth2_token_id=1223210874&signature=b7a193ea6104d91891f0e2aa2638711af6d4a29e3e1b9733031b5d927fafdc01" type="video/mp4"
poster="https://pikwizard.com/pw/medium/fbf5fabf7ece1b4d21aed584b7ba6605.jpg"/>
Your browser does not support the video tag.
</video>
<p style="font-size: 12px; margin: 0;">PikWizard</p>
</a>
</span>
</span>
Free (free of charge)
Free for personal and commercial use.
Author: Awesome Content