
- Home >
- Stock Videos >
- Dynamic Financial Data Analysis Displayed on Dark Interface
Dynamic Financial Data Analysis Displayed on Dark Interface Video
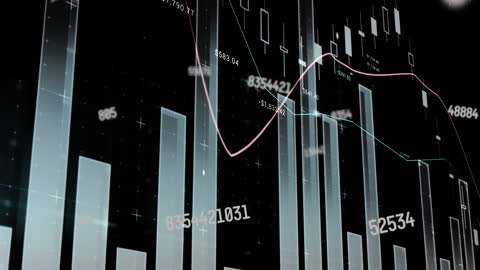
Animation depicting changing financial numbers represents real-time data analysis in business and finance. Perfect for themes related to stock market, technological innovation in data processing, vivid visual representation of statistics, or illustrative support for business technology presentations.
Powered by 


downloads
Tags:
More
Credit Photo
If you would like to credit the Photo, here are some ways you can do so
Text Link
video Link
<span class="text-link">
<span>
<a target="_blank" href=https://pikwizard.com/video/dynamic-financial-data-analysis-displayed-on-dark-interface/b16e8bace63755683134d5ee69239542/>PikWizard</a>
</span>
</span>
<span class="image-link">
<span
style="margin: 0 0 20px 0; display: inline-block; vertical-align: middle; width: 100%;"
>
<a
target="_blank"
href="https://pikwizard.com/video/dynamic-financial-data-analysis-displayed-on-dark-interface/b16e8bace63755683134d5ee69239542/"
style="text-decoration: none; font-size: 10px; margin: 0;"
>
<video controls style="width: 100%; margin: 0;">
<source src="https://player.vimeo.com/progressive_redirect/playback/826415725/rendition/240p/file.mp4?loc=external&oauth2_token_id=1223210874&signature=c8d028cb214304c58b0fc82b0a89b07a9bd0b5b97322fdd0625a511ebd5ea4e3" type="video/mp4"
poster="https://pikwizard.com/pw/medium/b16e8bace63755683134d5ee69239542.jpg"/>
Your browser does not support the video tag.
</video>
<p style="font-size: 12px; margin: 0;">PikWizard</p>
</a>
</span>
</span>
Free (free of charge)
Free for personal and commercial use.
Author: Awesome Content