
- Home >
- Stock Videos >
- Dynamic Financial Data Analysis with Code Overlay
Dynamic Financial Data Analysis with Code Overlay Video
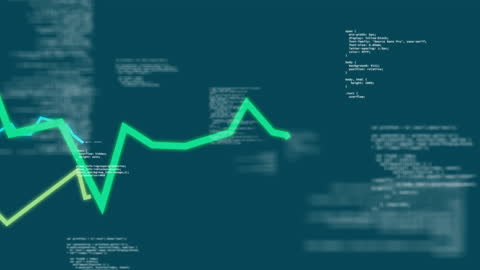
This illustration depicts financial data analysis represented by fluctuating graphs and code overlay on a dark background. The video suggests an intersection of finance and technology, ideal for showcasing modern financial services, economic trend reports, or technology-driven business strategies.

downloads
Tags:
More
Credit Photo
If you would like to credit the Photo, here are some ways you can do so
Text Link
video Link
<span class="text-link">
<span>
<a target="_blank" href=https://pikwizard.com/video/dynamic-financial-data-analysis-with-code-overlay/44cd0fe7474c2a637930929d5ed27e96/>PikWizard</a>
</span>
</span>
<span class="image-link">
<span
style="margin: 0 0 20px 0; display: inline-block; vertical-align: middle; width: 100%;"
>
<a
target="_blank"
href="https://pikwizard.com/video/dynamic-financial-data-analysis-with-code-overlay/44cd0fe7474c2a637930929d5ed27e96/"
style="text-decoration: none; font-size: 10px; margin: 0;"
>
<video controls style="width: 100%; margin: 0;">
<source src="https://player.vimeo.com/progressive_redirect/playback/771089431/rendition/240p/file.mp4?loc=external&oauth2_token_id=1223210874&signature=693405f4e9f0ef74f6b5ac78869b46002bfe3f68a828bfeebdffd576c8f99f7d" type="video/mp4"
poster="https://pikwizard.com/pw/medium/44cd0fe7474c2a637930929d5ed27e96.jpg"/>
Your browser does not support the video tag.
</video>
<p style="font-size: 12px; margin: 0;">PikWizard</p>
</a>
</span>
</span>
Free (free of charge)
Free for personal and commercial use.
Author: Awesome Content