
- Home >
- Stock Videos >
- Dynamic Financial Data Analysis with Graphs and Percentages
Dynamic Financial Data Analysis with Graphs and Percentages Video
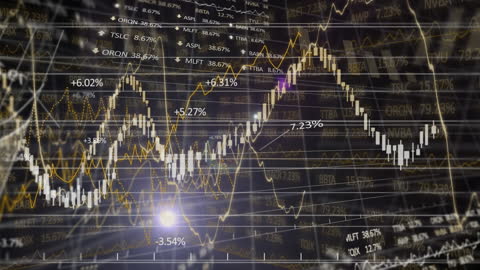
Depicts dynamic processing of financial data with animated graphs and statistical figures. Useful for illustrating concepts of global economic analysis, stock market predictions, or financial data management. Suitable for presentations on business trends or educational content about investments.

downloads
Tags:
More
Credit Photo
If you would like to credit the Photo, here are some ways you can do so
Text Link
video Link
<span class="text-link">
<span>
<a target="_blank" href=https://pikwizard.com/video/dynamic-financial-data-analysis-with-graphs-and-percentages/b04155ea2f8d8c56c50845d42342bffb/>PikWizard</a>
</span>
</span>
<span class="image-link">
<span
style="margin: 0 0 20px 0; display: inline-block; vertical-align: middle; width: 100%;"
>
<a
target="_blank"
href="https://pikwizard.com/video/dynamic-financial-data-analysis-with-graphs-and-percentages/b04155ea2f8d8c56c50845d42342bffb/"
style="text-decoration: none; font-size: 10px; margin: 0;"
>
<video controls style="width: 100%; margin: 0;">
<source src="https://player.vimeo.com/progressive_redirect/playback/790388988/rendition/240p/file.mp4?loc=external&oauth2_token_id=1223210874&signature=b5c16c79e208bbfb506c08fe9c6f11f0582ca10323740c680341feaa168cf9d7" type="video/mp4"
poster="https://pikwizard.com/pw/medium/b04155ea2f8d8c56c50845d42342bffb.jpg"/>
Your browser does not support the video tag.
</video>
<p style="font-size: 12px; margin: 0;">PikWizard</p>
</a>
</span>
</span>
Free (free of charge)
Free for personal and commercial use.
Author: Awesome Content