
- Home >
- Stock Videos >
- Dynamic Financial Data Analytics Interface with Graphs
Dynamic Financial Data Analytics Interface with Graphs Video
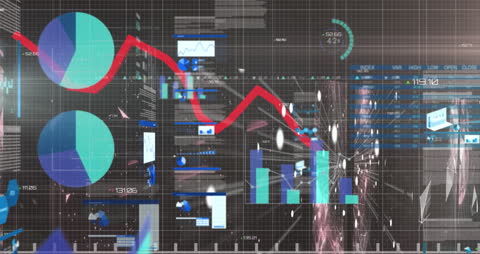
Colorful digital interface displays multiple graphs with a downward trend line. Concept represents financial data analysis and technology in business. Ideal usage includes financial reports and technology presentations. Adds a modern, high-tech feel to any data-driven content and can be used to enhance articles focusing on economics, market trends, and digital analytics.

downloads
Tags:
More
Credit Photo
If you would like to credit the Photo, here are some ways you can do so
Text Link
video Link
<span class="text-link">
<span>
<a target="_blank" href=https://pikwizard.com/video/dynamic-financial-data-analytics-interface-with-graphs/1807c9799cc9f260891ae1c9392f4600/>PikWizard</a>
</span>
</span>
<span class="image-link">
<span
style="margin: 0 0 20px 0; display: inline-block; vertical-align: middle; width: 100%;"
>
<a
target="_blank"
href="https://pikwizard.com/video/dynamic-financial-data-analytics-interface-with-graphs/1807c9799cc9f260891ae1c9392f4600/"
style="text-decoration: none; font-size: 10px; margin: 0;"
>
<video controls style="width: 100%; margin: 0;">
<source src="https://player.vimeo.com/progressive_redirect/playback/767893768/rendition/240p/file.mp4?loc=external&oauth2_token_id=1223210874&signature=edb43294cf5d0e08ed52ba9a89958692ad36451abc2c6183a6af34347fba4678" type="video/mp4"
poster="https://pikwizard.com/pw/medium/1807c9799cc9f260891ae1c9392f4600.jpg"/>
Your browser does not support the video tag.
</video>
<p style="font-size: 12px; margin: 0;">PikWizard</p>
</a>
</span>
</span>
Free (free of charge)
Free for personal and commercial use.
Author: Awesome Content