
- Home >
- Stock Videos >
- Dynamic Financial Data Analytics Movement with Charts
Dynamic Financial Data Analytics Movement with Charts Video
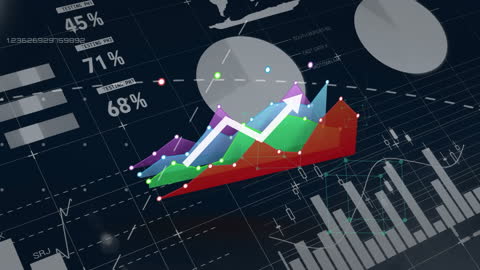
Graphic displaying animated chart visuals within digital interface conveying business data trends and analysis is shown. Suitable for presentations on financial markets, investment strategies, or Big Data analysis initiatives highlighting technology in modern business environments.
Powered by  - Get 15% off with code: PIKWIZARD15


downloads
Tags:
More
Credit Photo
If you would like to credit the Photo, here are some ways you can do so
Text Link
video Link
<span class="text-link">
<span>
<a target="_blank" href=https://pikwizard.com/video/dynamic-financial-data-analytics-movement-with-charts/72824b52a8437d4974f17afc1865c23c/>PikWizard</a>
</span>
</span>
<span class="image-link">
<span
style="margin: 0 0 20px 0; display: inline-block; vertical-align: middle; width: 100%;"
>
<a
target="_blank"
href="https://pikwizard.com/video/dynamic-financial-data-analytics-movement-with-charts/72824b52a8437d4974f17afc1865c23c/"
style="text-decoration: none; font-size: 10px; margin: 0;"
>
<video controls style="width: 100%; margin: 0;">
<source src="https://player.vimeo.com/progressive_redirect/playback/718840251/rendition/240p/file.mp4?loc=external&oauth2_token_id=1223210874&signature=316e5f4b3b7f0a1b1cef7f77bcd37a2fc2648fef4a0e72584837c8542924e4ee" type="video/mp4"
poster="https://pikwizard.com/pw/medium/72824b52a8437d4974f17afc1865c23c.jpg"/>
Your browser does not support the video tag.
</video>
<p style="font-size: 12px; margin: 0;">PikWizard</p>
</a>
</span>
</span>
Free (free of charge)
Free for personal and commercial use.
Author: Awesome Content