
- Home >
- Stock Videos >
- Dynamic Financial Data Analyzing Grid with Moving Chart
Dynamic Financial Data Analyzing Grid with Moving Chart Video
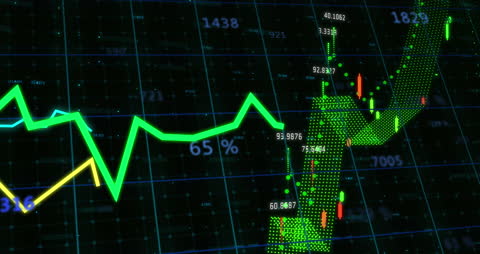
Scene features brightly colored line graphs and stock prices dynamically displayed against a dark digital grid background. Fine details of bar and candlestick charts illustrate real-time financial and market data, making this highly relevant for topics on trade analysis reports, global economic trends, market forecasts, and financial investments.
Powered by  - Get 15% off with code: PIKWIZARD15


downloads
Tags:
More
Credit Photo
If you would like to credit the Photo, here are some ways you can do so
Text Link
video Link
<span class="text-link">
<span>
<a target="_blank" href=https://pikwizard.com/video/dynamic-financial-data-analyzing-grid-with-moving-chart/b453c26d508a196a70ff2472ac3bea32/>PikWizard</a>
</span>
</span>
<span class="image-link">
<span
style="margin: 0 0 20px 0; display: inline-block; vertical-align: middle; width: 100%;"
>
<a
target="_blank"
href="https://pikwizard.com/video/dynamic-financial-data-analyzing-grid-with-moving-chart/b453c26d508a196a70ff2472ac3bea32/"
style="text-decoration: none; font-size: 10px; margin: 0;"
>
<video controls style="width: 100%; margin: 0;">
<source src="https://player.vimeo.com/progressive_redirect/playback/839403267/rendition/540p/file.mp4?loc=external&oauth2_token_id=1223210874&signature=b9ef0a6bf8fb4797316adf90a8eeff1db8067e4f5d853e21f5c1285eddc3ea6a" type="video/mp4"
poster="https://pikwizard.com/pw/medium/b453c26d508a196a70ff2472ac3bea32.jpg"/>
Your browser does not support the video tag.
</video>
<p style="font-size: 12px; margin: 0;">PikWizard</p>
</a>
</span>
</span>
Free (free of charge)
Free for personal and commercial use.
Author: Awesome Content