
- Home >
- Stock Videos >
- Dynamic Financial Data and Chart Analysis Visualization
Dynamic Financial Data and Chart Analysis Visualization Video
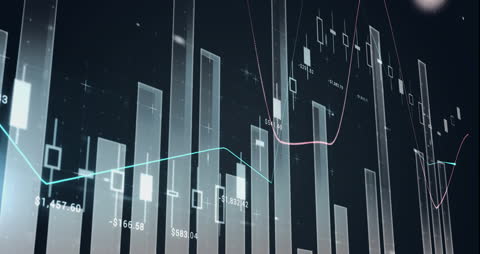
Visualization showcases complex financial data processing with animated charts. Suitable for materials related to finance, stock market analysis, investment strategy, and economic reports. Useful in presentations, financial technology interfaces, and educational content on data analytics.

downloads
Tags:
More
Credit Photo
If you would like to credit the Photo, here are some ways you can do so
Text Link
video Link
<span class="text-link">
<span>
<a target="_blank" href=https://pikwizard.com/video/dynamic-financial-data-and-chart-analysis-visualization/1a6b528e7f266d7f3a261f2070b329f5/>PikWizard</a>
</span>
</span>
<span class="image-link">
<span
style="margin: 0 0 20px 0; display: inline-block; vertical-align: middle; width: 100%;"
>
<a
target="_blank"
href="https://pikwizard.com/video/dynamic-financial-data-and-chart-analysis-visualization/1a6b528e7f266d7f3a261f2070b329f5/"
style="text-decoration: none; font-size: 10px; margin: 0;"
>
<video controls style="width: 100%; margin: 0;">
<source src="https://player.vimeo.com/progressive_redirect/playback/767119790/rendition/240p/file.mp4?loc=external&oauth2_token_id=1223210874&signature=a477473724833901f0469fa756a9461f89c65ed4fb2ad3af8a9d502ec9ef59e7" type="video/mp4"
poster="https://pikwizard.com/pw/medium/1a6b528e7f266d7f3a261f2070b329f5.jpg"/>
Your browser does not support the video tag.
</video>
<p style="font-size: 12px; margin: 0;">PikWizard</p>
</a>
</span>
</span>
Free (free of charge)
Free for personal and commercial use.
Author: Awesome Content