
- Home >
- Stock Videos >
- Dynamic Financial Data and Global Connections Analysis
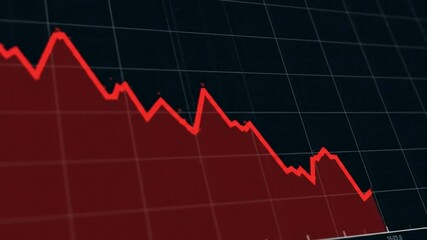
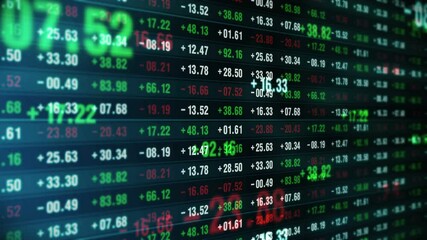
Dynamic Financial Data and Global Connections Analysis Video
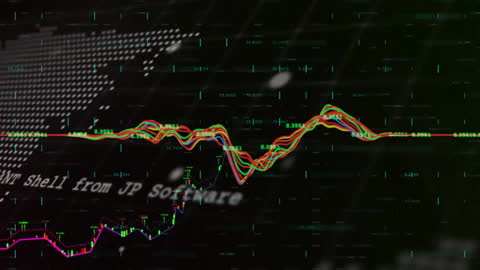
Animation depicting dynamic financial data and graphs overlaying a world map. Illustrates concepts of global trading and investment, useful for presentations on financial technology, data analysis, and stock market trends.
Powered by 


downloads
Tags:
More
Credit Photo
If you would like to credit the Photo, here are some ways you can do so
Text Link
video Link
<span class="text-link">
<span>
<a target="_blank" href=https://pikwizard.com/video/dynamic-financial-data-and-global-connections-analysis/b6ae2f457988b5d38fd4a3c7ee3afb8a/>PikWizard</a>
</span>
</span>
<span class="image-link">
<span
style="margin: 0 0 20px 0; display: inline-block; vertical-align: middle; width: 100%;"
>
<a
target="_blank"
href="https://pikwizard.com/video/dynamic-financial-data-and-global-connections-analysis/b6ae2f457988b5d38fd4a3c7ee3afb8a/"
style="text-decoration: none; font-size: 10px; margin: 0;"
>
<video controls style="width: 100%; margin: 0;">
<source src="https://player.vimeo.com/progressive_redirect/playback/887879383/rendition/540p/file.mp4?loc=external&oauth2_token_id=1223210874&signature=43581abf7387f8c7a9fe381be874d5f08eb6d615f82c5ca3716a70fd00dbc2e5" type="video/mp4"
poster="https://pikwizard.com/pw/medium/b6ae2f457988b5d38fd4a3c7ee3afb8a.jpg"/>
Your browser does not support the video tag.
</video>
<p style="font-size: 12px; margin: 0;">PikWizard</p>
</a>
</span>
</span>
Free (free of charge)
Free for personal and commercial use.
Author: Awesome Content