
- Home >
- Stock Videos >
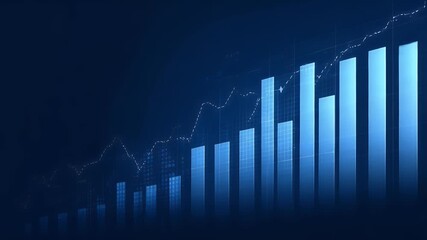
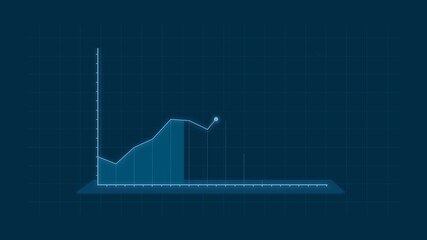
- Dynamic Financial Data Animation with Digital Overlay
Dynamic Financial Data Animation with Digital Overlay Video

Visually engaging depiction of fluctuating financial numbers and a bar graph, representing the dynamics of stock markets. Ideal for use in business presentations, financial reports, and technology-themed videos. It can effectively illustrate trends in market data, economic growth, or technology development.
Powered by 


downloads
Tags:
More
Credit Photo
If you would like to credit the Photo, here are some ways you can do so
Text Link
video Link
<span class="text-link">
<span>
<a target="_blank" href=https://pikwizard.com/video/dynamic-financial-data-animation-with-digital-overlay/65fa40e3287d577defaf3e5f85249bff/>PikWizard</a>
</span>
</span>
<span class="image-link">
<span
style="margin: 0 0 20px 0; display: inline-block; vertical-align: middle; width: 100%;"
>
<a
target="_blank"
href="https://pikwizard.com/video/dynamic-financial-data-animation-with-digital-overlay/65fa40e3287d577defaf3e5f85249bff/"
style="text-decoration: none; font-size: 10px; margin: 0;"
>
<video controls style="width: 100%; margin: 0;">
<source src="https://player.vimeo.com/progressive_redirect/playback/849350340/rendition/240p/file.mp4?loc=external&oauth2_token_id=1223210874&signature=028187189733733aa9259a81c425cde481100722ac0f9a3aeb11df0694b20dce" type="video/mp4"
poster="https://pikwizard.com/pw/medium/65fa40e3287d577defaf3e5f85249bff.jpg"/>
Your browser does not support the video tag.
</video>
<p style="font-size: 12px; margin: 0;">PikWizard</p>
</a>
</span>
</span>
Free (free of charge)
Free for personal and commercial use.
Author: Awesome Content