
- Home >
- Stock Videos >
- Dynamic Financial Data Animation with Global Analytics
Dynamic Financial Data Animation with Global Analytics Video
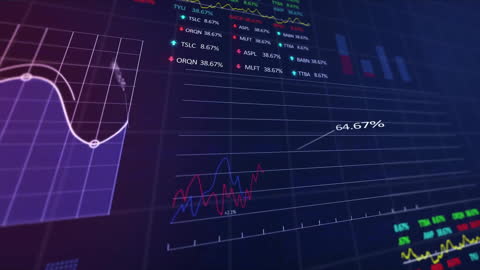
Animation featuring colorful financial data overlay on blue background with dynamic charts and analytics. Shows stock performance, data trends, graph movement, making it ideal for finance presentations, stock market analysis, economic forecasting conferences, technology showcase in business, or digital media related to global investments and analytics.

downloads
Tags:
More
Credit Photo
If you would like to credit the Photo, here are some ways you can do so
Text Link
video Link
<span class="text-link">
<span>
<a target="_blank" href=https://pikwizard.com/video/dynamic-financial-data-animation-with-global-analytics/fbaa3b9aeb6e29c2f78ae52e5f368a0c/>PikWizard</a>
</span>
</span>
<span class="image-link">
<span
style="margin: 0 0 20px 0; display: inline-block; vertical-align: middle; width: 100%;"
>
<a
target="_blank"
href="https://pikwizard.com/video/dynamic-financial-data-animation-with-global-analytics/fbaa3b9aeb6e29c2f78ae52e5f368a0c/"
style="text-decoration: none; font-size: 10px; margin: 0;"
>
<video controls style="width: 100%; margin: 0;">
<source src="https://player.vimeo.com/progressive_redirect/playback/913854067/rendition/540p/file.mp4?loc=external&oauth2_token_id=1223210874&signature=f7ec1ca09a5e4c60646c6eb3230ec02757534a85b5dc5b32393919e66e6b1da4" type="video/mp4"
poster="https://pikwizard.com/pw/medium/fbaa3b9aeb6e29c2f78ae52e5f368a0c.jpg"/>
Your browser does not support the video tag.
</video>
<p style="font-size: 12px; margin: 0;">PikWizard</p>
</a>
</span>
</span>
Free (free of charge)
Free for personal and commercial use.
Author: Awesome Content