
- Home >
- Stock Videos >
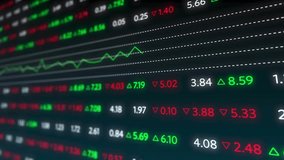
- Dynamic Financial Data Animation with Glowing Graph
Dynamic Financial Data Animation with Glowing Graph Video
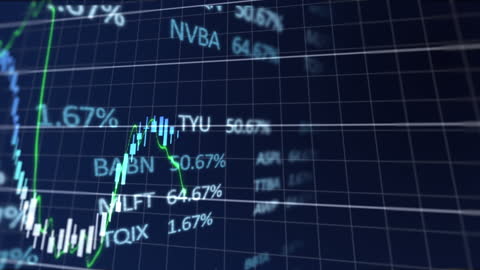
Illustrates movement of financial data across a digital grid, highlighting dynamic economic trends. Ideal for financial presentations, investment analyses, economic reports, technology backgrounds, and educational materials regarding market trends and data analytics.
Powered by  - Get 15% off with code: PIKWIZARD15


downloads
Tags:
More
Credit Photo
If you would like to credit the Photo, here are some ways you can do so
Text Link
video Link
<span class="text-link">
<span>
<a target="_blank" href=https://pikwizard.com/video/dynamic-financial-data-animation-with-glowing-graph/330441c86e87d1746bdfb645678514d5/>PikWizard</a>
</span>
</span>
<span class="image-link">
<span
style="margin: 0 0 20px 0; display: inline-block; vertical-align: middle; width: 100%;"
>
<a
target="_blank"
href="https://pikwizard.com/video/dynamic-financial-data-animation-with-glowing-graph/330441c86e87d1746bdfb645678514d5/"
style="text-decoration: none; font-size: 10px; margin: 0;"
>
<video controls style="width: 100%; margin: 0;">
<source src="https://player.vimeo.com/progressive_redirect/playback/717008114/rendition/240p/file.mp4?loc=external&oauth2_token_id=1223210874&signature=8a5c8c1be32524ff48d176ba21aa14ada7d197f4069ef92959175068b6d1978d" type="video/mp4"
poster="https://pikwizard.com/pw/medium/330441c86e87d1746bdfb645678514d5.jpg"/>
Your browser does not support the video tag.
</video>
<p style="font-size: 12px; margin: 0;">PikWizard</p>
</a>
</span>
</span>
Free (free of charge)
Free for personal and commercial use.
Author: Awesome Content