
- Home >
- Stock Videos >
- Dynamic Financial Data Animation with Line Graph
Dynamic Financial Data Animation with Line Graph Video
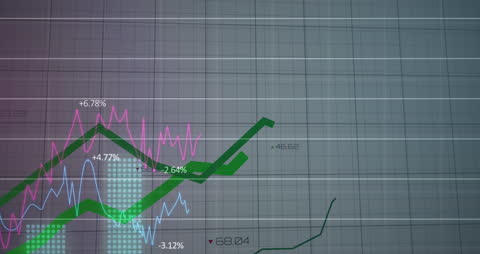
This concept video features a dynamic green line graph illustrating financial data over a grid background. The data plot includes percentages indicating market fluctuations in vibrant colors. Perfect for presentations, educational material, or articles on finance, stock market trends, or investment analysis.
Powered by 


downloads
Tags:
More
Credit Photo
If you would like to credit the Photo, here are some ways you can do so
Text Link
video Link
<span class="text-link">
<span>
<a target="_blank" href=https://pikwizard.com/video/dynamic-financial-data-animation-with-line-graph/b64bf75a1f1cd64c574de295d4c914a9/>PikWizard</a>
</span>
</span>
<span class="image-link">
<span
style="margin: 0 0 20px 0; display: inline-block; vertical-align: middle; width: 100%;"
>
<a
target="_blank"
href="https://pikwizard.com/video/dynamic-financial-data-animation-with-line-graph/b64bf75a1f1cd64c574de295d4c914a9/"
style="text-decoration: none; font-size: 10px; margin: 0;"
>
<video controls style="width: 100%; margin: 0;">
<source src="https://player.vimeo.com/progressive_redirect/playback/717452716/rendition/240p/file.mp4?loc=external&oauth2_token_id=1223210874&signature=e2cc3335849214e957f830b57f92c1bf4e670cbb6536f9a111baac5cd251ce97" type="video/mp4"
poster="https://pikwizard.com/pw/medium/b64bf75a1f1cd64c574de295d4c914a9.jpg"/>
Your browser does not support the video tag.
</video>
<p style="font-size: 12px; margin: 0;">PikWizard</p>
</a>
</span>
</span>
Free (free of charge)
Free for personal and commercial use.
Author: Awesome Content