
- Home >
- Stock Videos >
- Dynamic Financial Data Animation with Real-Time Statistics
Dynamic Financial Data Animation with Real-Time Statistics Video
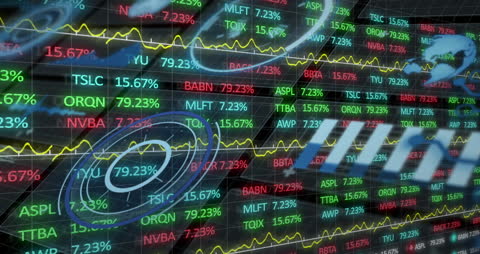
This animation depicts digital financial data processing with various stock statistics and graphs in real-time, commonly used in global finance sectors. The overlay of numbers and graphs symbolizes dynamic analysis and trading activities. Ideal for presentations or educational content about stock market trends, financial analyses, or technology-driven trading strategies.

downloads
Tags:
More
Credit Photo
If you would like to credit the Photo, here are some ways you can do so
Text Link
video Link
<span class="text-link">
<span>
<a target="_blank" href=https://pikwizard.com/video/dynamic-financial-data-animation-with-real-time-statistics/f498bbc7ab9181936a1f63e2524e2354/>PikWizard</a>
</span>
</span>
<span class="image-link">
<span
style="margin: 0 0 20px 0; display: inline-block; vertical-align: middle; width: 100%;"
>
<a
target="_blank"
href="https://pikwizard.com/video/dynamic-financial-data-animation-with-real-time-statistics/f498bbc7ab9181936a1f63e2524e2354/"
style="text-decoration: none; font-size: 10px; margin: 0;"
>
<video controls style="width: 100%; margin: 0;">
<source src="https://player.vimeo.com/progressive_redirect/playback/758250199/rendition/240p/file.mp4?loc=external&oauth2_token_id=1223210874&signature=304f84ac23ac576454245c8ef9a8f2f4f21a3f0e4e58c3b0456c459ecd1fe0c2" type="video/mp4"
poster="https://pikwizard.com/pw/medium/f498bbc7ab9181936a1f63e2524e2354.jpg"/>
Your browser does not support the video tag.
</video>
<p style="font-size: 12px; margin: 0;">PikWizard</p>
</a>
</span>
</span>
Free (free of charge)
Free for personal and commercial use.
Author: Awesome Content