
- Home >
- Stock Videos >
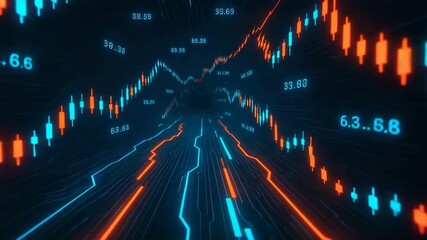
- Dynamic Financial Data Charts with Motion Graphics
Dynamic Financial Data Charts with Motion Graphics Video
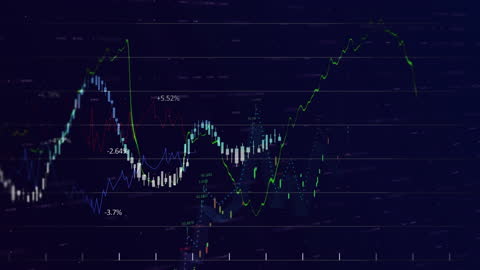
Varying graphs and charts depicting financial data. Ideal for presentations on stock markets, financial analysis, or investment strategies. Intricate graphics serve well for media related to economic forecasts and trading platforms.
Powered by 


downloads
Tags:
More
Credit Photo
If you would like to credit the Photo, here are some ways you can do so
Text Link
video Link
<span class="text-link">
<span>
<a target="_blank" href=https://pikwizard.com/video/dynamic-financial-data-charts-with-motion-graphics/98a5e07c88e79495450bb32e6bd02aae/>PikWizard</a>
</span>
</span>
<span class="image-link">
<span
style="margin: 0 0 20px 0; display: inline-block; vertical-align: middle; width: 100%;"
>
<a
target="_blank"
href="https://pikwizard.com/video/dynamic-financial-data-charts-with-motion-graphics/98a5e07c88e79495450bb32e6bd02aae/"
style="text-decoration: none; font-size: 10px; margin: 0;"
>
<video controls style="width: 100%; margin: 0;">
<source src="https://player.vimeo.com/progressive_redirect/playback/743617862/rendition/240p/file.mp4?loc=external&oauth2_token_id=1223210874&signature=0dade8cddcd356565e10f1591dc7c112b9810f887fffcf8c907d2a62b1ea59d1" type="video/mp4"
poster="https://pikwizard.com/pw/medium/98a5e07c88e79495450bb32e6bd02aae.jpg"/>
Your browser does not support the video tag.
</video>
<p style="font-size: 12px; margin: 0;">PikWizard</p>
</a>
</span>
</span>
Free (free of charge)
Free for personal and commercial use.
Author: Awesome Content