
- Home >
- Stock Videos >
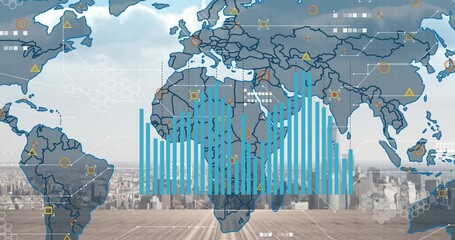
- Dynamic Financial Data Display on World Map
Dynamic Financial Data Display on World Map Video

Illustration depicts lively movement of financial data on a world map, suggesting global economic flow and technological integration. Vibrant graphics with abstract lighting align with themes of international business and stock market fluctuations, making it applicable for financial reports, educational material, or presentations on globalization and technology in economics.
Powered by 


downloads
Tags:
More
Credit Photo
If you would like to credit the Photo, here are some ways you can do so
Text Link
video Link
<span class="text-link">
<span>
<a target="_blank" href=https://pikwizard.com/video/dynamic-financial-data-display-on-world-map/5c2371027f27dffcda22c5bac95fd909/>PikWizard</a>
</span>
</span>
<span class="image-link">
<span
style="margin: 0 0 20px 0; display: inline-block; vertical-align: middle; width: 100%;"
>
<a
target="_blank"
href="https://pikwizard.com/video/dynamic-financial-data-display-on-world-map/5c2371027f27dffcda22c5bac95fd909/"
style="text-decoration: none; font-size: 10px; margin: 0;"
>
<video controls style="width: 100%; margin: 0;">
<source src="https://player.vimeo.com/progressive_redirect/playback/718624214/rendition/240p/file.mp4?loc=external&oauth2_token_id=1223210874&signature=b79fe4053d69018353799a23f2a384b3a5793af81efbd02208722cf0dbc04af7" type="video/mp4"
poster="https://pikwizard.com/pw/medium/5c2371027f27dffcda22c5bac95fd909.jpg"/>
Your browser does not support the video tag.
</video>
<p style="font-size: 12px; margin: 0;">PikWizard</p>
</a>
</span>
</span>
Free (free of charge)
Free for personal and commercial use.
Author: Awesome Content