
- Home >
- Stock Videos >
- Dynamic Financial Data Display with Chart and Graphs
Dynamic Financial Data Display with Chart and Graphs Video
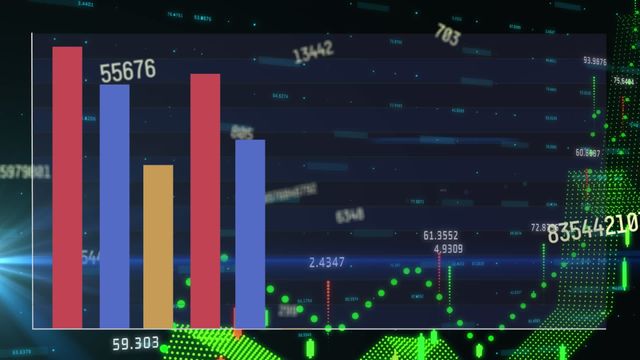
Vibrant visual composition of financial data in a dynamic animation with numbers and bar chart set against a blue digital interface. Ideal for illustrating concepts related to modern business analytics, data processing technology, financial reporting, or statistics presentations. Suitable for use in financial education materials or business technology advertisements.
Powered by 


downloads
Tags:
More
Credit Photo
If you would like to credit the Photo, here are some ways you can do so
Text Link
video Link
<span class="text-link">
<span>
<a target="_blank" href=https://pikwizard.com/video/dynamic-financial-data-display-with-chart-and-graphs/3e0bc1cdce63b09d843240fdba47d474/>PikWizard</a>
</span>
</span>
<span class="image-link">
<span
style="margin: 0 0 20px 0; display: inline-block; vertical-align: middle; width: 100%;"
>
<a
target="_blank"
href="https://pikwizard.com/video/dynamic-financial-data-display-with-chart-and-graphs/3e0bc1cdce63b09d843240fdba47d474/"
style="text-decoration: none; font-size: 10px; margin: 0;"
>
<video controls style="width: 100%; margin: 0;">
<source src="https://player.vimeo.com/progressive_redirect/playback/839608196/rendition/240p/file.mp4?loc=external&oauth2_token_id=1223210874&signature=f39b686bc12090c277f5a1a79cbb49aa78a82f85444a382204d52c48a488b9b4" type="video/mp4"
poster="https://pikwizard.com/pw/medium/3e0bc1cdce63b09d843240fdba47d474.jpg"/>
Your browser does not support the video tag.
</video>
<p style="font-size: 12px; margin: 0;">PikWizard</p>
</a>
</span>
</span>
Free (free of charge)
Free for personal and commercial use.
Author: Awesome Content