
- Home >
- Stock Videos >
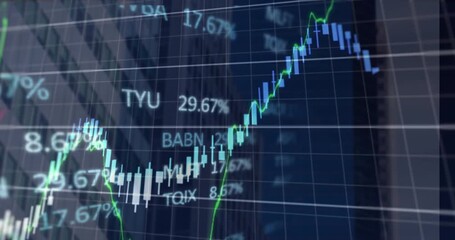
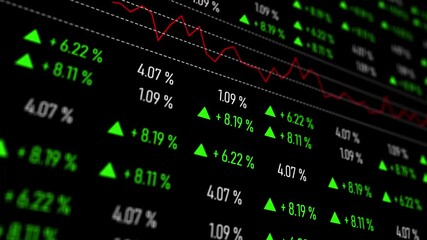
- Dynamic Financial Data Display with Digital Charts
Dynamic Financial Data Display with Digital Charts Video
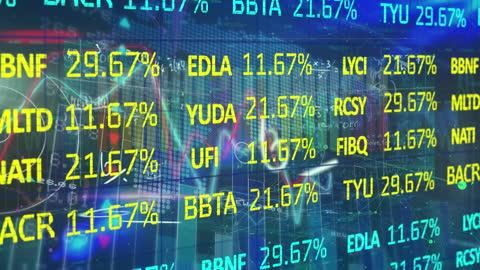
An animated representation of market data with colorful, fluctuating numbers and stock symbols across a digital screen. Ideal for presentations on finance topics, economic reports, or visual supplements for trading and investment content. This video portrays the dynamic, fast-paced nature of stock markets and data analysis.
Powered by 


downloads
Tags:
More
Credit Photo
If you would like to credit the Photo, here are some ways you can do so
Text Link
video Link
<span class="text-link">
<span>
<a target="_blank" href=https://pikwizard.com/video/dynamic-financial-data-display-with-digital-charts/57bcfb22d59d875b8fe8bbdf95df9d23/>PikWizard</a>
</span>
</span>
<span class="image-link">
<span
style="margin: 0 0 20px 0; display: inline-block; vertical-align: middle; width: 100%;"
>
<a
target="_blank"
href="https://pikwizard.com/video/dynamic-financial-data-display-with-digital-charts/57bcfb22d59d875b8fe8bbdf95df9d23/"
style="text-decoration: none; font-size: 10px; margin: 0;"
>
<video controls style="width: 100%; margin: 0;">
<source src="https://player.vimeo.com/progressive_redirect/playback/908020904/rendition/240p/file.mp4?loc=external&oauth2_token_id=1223210874&signature=9f14afa1124d6837f180a41a9481bc05eca2300e060dd8bd1814e64af438a611" type="video/mp4"
poster="https://pikwizard.com/pw/medium/57bcfb22d59d875b8fe8bbdf95df9d23.jpg"/>
Your browser does not support the video tag.
</video>
<p style="font-size: 12px; margin: 0;">PikWizard</p>
</a>
</span>
</span>
Free (free of charge)
Free for personal and commercial use.
Author: Awesome Content