
- Home >
- Stock Videos >
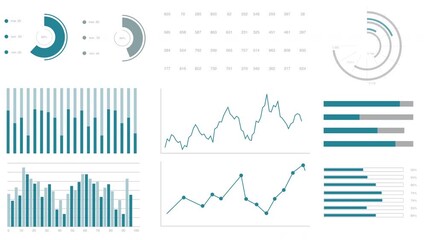
- Dynamic Financial Data Display with Graphs and Indicators
Dynamic Financial Data Display with Graphs and Indicators Video

Vibrant depiction of a digital screen showcasing dynamic financial data and graphical indicators. Bars and line graphs present real-time market analytics and evolving statistics. Useful for illustrating economic reports, technology presentations, or concepts in finance sectors.
Powered by 


downloads
Tags:
More
Credit Photo
If you would like to credit the Photo, here are some ways you can do so
Text Link
video Link
<span class="text-link">
<span>
<a target="_blank" href=https://pikwizard.com/video/dynamic-financial-data-display-with-graphs-and-indicators/efe870a13d877994b81aa89bbae229dc/>PikWizard</a>
</span>
</span>
<span class="image-link">
<span
style="margin: 0 0 20px 0; display: inline-block; vertical-align: middle; width: 100%;"
>
<a
target="_blank"
href="https://pikwizard.com/video/dynamic-financial-data-display-with-graphs-and-indicators/efe870a13d877994b81aa89bbae229dc/"
style="text-decoration: none; font-size: 10px; margin: 0;"
>
<video controls style="width: 100%; margin: 0;">
<source src="https://player.vimeo.com/progressive_redirect/playback/746264228/rendition/240p/file.mp4?loc=external&oauth2_token_id=1223210874&signature=b98c0b1fa1f00eb907b8595e04b5f7832d1d3ed6d44ef55949086a96af5f7c0e" type="video/mp4"
poster="https://pikwizard.com/pw/medium/efe870a13d877994b81aa89bbae229dc.jpg"/>
Your browser does not support the video tag.
</video>
<p style="font-size: 12px; margin: 0;">PikWizard</p>
</a>
</span>
</span>
Free (free of charge)
Free for personal and commercial use.
Author: Awesome Content