
- Home >
- Stock Videos >
- Dynamic Financial Data Display with Market Trends Animation
Dynamic Financial Data Display with Market Trends Animation Video
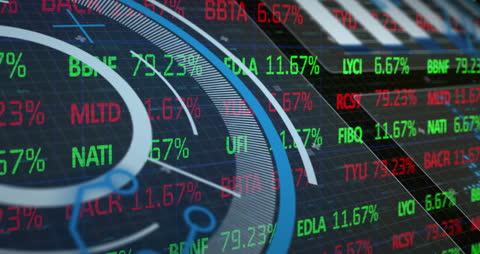
This digital illustration features a futuristic data interface with fluctuating stock figures in bold colors. It reflects the dynamic nature of financial markets and technology. Suitable for use in presentations or articles about financial markets, fintech innovations, or global business trends.
Powered by  - Get 15% off with code: PIKWIZARD15


0
downloads
downloads
Tags:
More
Credit Photo
If you would like to credit the Photo, here are some ways you can do so
Text Link
video Link
<span class="text-link">
<span>
<a target="_blank" href=https://pikwizard.com/video/dynamic-financial-data-display-with-market-trends-animation/72a3c6111f5fb85dd28b16e71cc5f6e5/>PikWizard</a>
</span>
</span>
<span class="image-link">
<span
style="margin: 0 0 20px 0; display: inline-block; vertical-align: middle; width: 100%;"
>
<a
target="_blank"
href="https://pikwizard.com/video/dynamic-financial-data-display-with-market-trends-animation/72a3c6111f5fb85dd28b16e71cc5f6e5/"
style="text-decoration: none; font-size: 10px; margin: 0;"
>
<video controls style="width: 100%; margin: 0;">
<source src="https://player.vimeo.com/progressive_redirect/playback/760165973/rendition/240p/file.mp4?loc=external&oauth2_token_id=1223210874&signature=f64aebd26b12877fe57e4d6750d3a56f36bb9b8c88cf380d9fb7faadc0531293" type="video/mp4"
poster="https://pikwizard.com/pw/medium/72a3c6111f5fb85dd28b16e71cc5f6e5.jpg"/>
Your browser does not support the video tag.
</video>
<p style="font-size: 12px; margin: 0;">PikWizard</p>
</a>
</span>
</span>
Free (free of charge)
Free for personal and commercial use.
Author: Awesome Content