
- Home >
- Stock Videos >
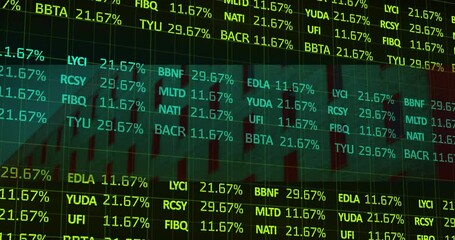
- Dynamic Financial Data Display with Stock Percentage Changes
Dynamic Financial Data Display with Stock Percentage Changes Video
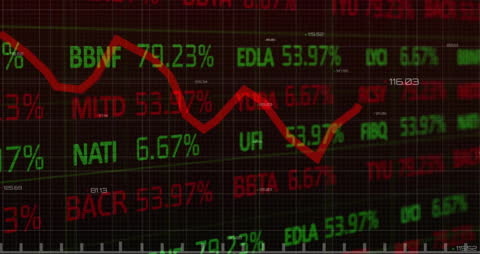
Dynamic graphic showing fluctuating stock percentages on digital display. Red line graph signifies market volatility, useful for business presentations, finance-related articles, or educational materials focusing on economic trends.
Powered by 


downloads
Tags:
More
Credit Photo
If you would like to credit the Photo, here are some ways you can do so
Text Link
video Link
<span class="text-link">
<span>
<a target="_blank" href=https://pikwizard.com/video/dynamic-financial-data-display-with-stock-percentage-changes/4209e844e59180ff7f2eac61442e11de/>PikWizard</a>
</span>
</span>
<span class="image-link">
<span
style="margin: 0 0 20px 0; display: inline-block; vertical-align: middle; width: 100%;"
>
<a
target="_blank"
href="https://pikwizard.com/video/dynamic-financial-data-display-with-stock-percentage-changes/4209e844e59180ff7f2eac61442e11de/"
style="text-decoration: none; font-size: 10px; margin: 0;"
>
<video controls style="width: 100%; margin: 0;">
<source src="https://player.vimeo.com/progressive_redirect/playback/890291699/rendition/240p/file.mp4?loc=external&oauth2_token_id=1223210874&signature=d7e054d953425b54af7de4d7ce5a1b63337c5d813b6bf6d0858a8fa91a008dae" type="video/mp4"
poster="https://pikwizard.com/pw/medium/4209e844e59180ff7f2eac61442e11de.jpg"/>
Your browser does not support the video tag.
</video>
<p style="font-size: 12px; margin: 0;">PikWizard</p>
</a>
</span>
</span>
Free (free of charge)
Free for personal and commercial use.
Author: Awesome Content