
- Home >
- Stock Videos >
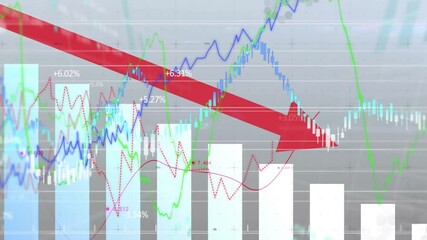
- Dynamic Financial Data Grid Showing Stock Market Percentages
Dynamic Financial Data Grid Showing Stock Market Percentages Video
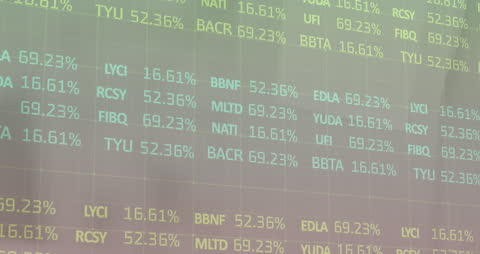
Display shows dynamic percentages of various financial indices, illustrating global financial networks and economies. Ideal for using in business, finance-related blogs, or articles to convey concepts of stock markets or data processing.
Powered by 


0
downloads
downloads
Tags:
More
Credit Photo
If you would like to credit the Photo, here are some ways you can do so
Text Link
video Link
<span class="text-link">
<span>
<a target="_blank" href=https://pikwizard.com/video/dynamic-financial-data-grid-showing-stock-market-percentages/f25e74405945fc1491b05c5e57e150d9/>PikWizard</a>
</span>
</span>
<span class="image-link">
<span
style="margin: 0 0 20px 0; display: inline-block; vertical-align: middle; width: 100%;"
>
<a
target="_blank"
href="https://pikwizard.com/video/dynamic-financial-data-grid-showing-stock-market-percentages/f25e74405945fc1491b05c5e57e150d9/"
style="text-decoration: none; font-size: 10px; margin: 0;"
>
<video controls style="width: 100%; margin: 0;">
<source src="https://player.vimeo.com/progressive_redirect/playback/826774941/rendition/240p/file.mp4?loc=external&oauth2_token_id=1223210874&signature=7fcfbbba85b5dea6fac88d2863729b529945ff5101d92f06dbd717cc05d09787" type="video/mp4"
poster="https://pikwizard.com/pw/medium/f25e74405945fc1491b05c5e57e150d9.jpg"/>
Your browser does not support the video tag.
</video>
<p style="font-size: 12px; margin: 0;">PikWizard</p>
</a>
</span>
</span>
Free (free of charge)
Free for personal and commercial use.
Author: Awesome Content