
- Home >
- Stock Videos >
- Dynamic Financial Data on Graph with Grid Background
Dynamic Financial Data on Graph with Grid Background Video
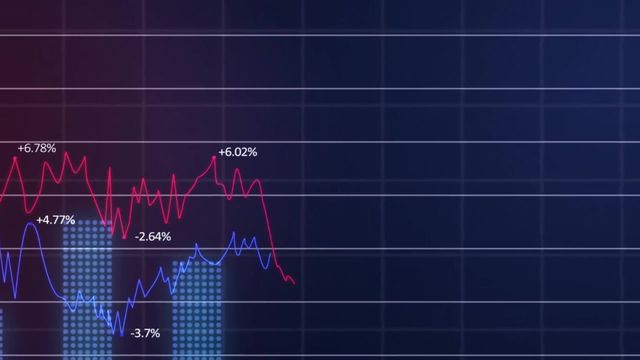
Animation depicts fluctuating financial data over a grid, symbolizing dynamic market changes. Useful for presentations, financial analysis reports, business forecasts and educational materials related to economic trends and data processing.
Powered by  - Get 15% off with code: PIKWIZARD15


downloads
Tags:
More
Credit Photo
If you would like to credit the Photo, here are some ways you can do so
Text Link
video Link
<span class="text-link">
<span>
<a target="_blank" href=https://pikwizard.com/video/dynamic-financial-data-on-graph-with-grid-background/813d7c6c27d494940956a0bf4c9f005d/>PikWizard</a>
</span>
</span>
<span class="image-link">
<span
style="margin: 0 0 20px 0; display: inline-block; vertical-align: middle; width: 100%;"
>
<a
target="_blank"
href="https://pikwizard.com/video/dynamic-financial-data-on-graph-with-grid-background/813d7c6c27d494940956a0bf4c9f005d/"
style="text-decoration: none; font-size: 10px; margin: 0;"
>
<video controls style="width: 100%; margin: 0;">
<source src="https://player.vimeo.com/progressive_redirect/playback/907876907/rendition/240p/file.mp4?loc=external&oauth2_token_id=1223210874&signature=1da0f9f0afe7ca400706c1a6f144498bdcfb48868e443558200a1932eace4af5" type="video/mp4"
poster="https://pikwizard.com/pw/medium/813d7c6c27d494940956a0bf4c9f005d.jpg"/>
Your browser does not support the video tag.
</video>
<p style="font-size: 12px; margin: 0;">PikWizard</p>
</a>
</span>
</span>
Free (free of charge)
Free for personal and commercial use.
Author: Awesome Content