
- Home >
- Stock Videos >
- Dynamic Financial Data Processing Animation on Grid
Dynamic Financial Data Processing Animation on Grid Video
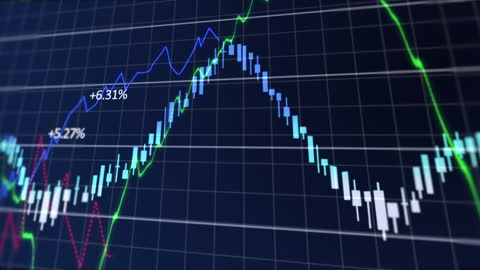
This illustrated animation shows turbulent shifts in financial data, financial market trends, and potential investment opportunities. Blue and green lines, along with percentages, depict market performance. Useful for presentations on global finance dynamics, lessons in economic variations during a pandemic, and videory framing business reports.

downloads
Tags:
More
Credit Photo
If you would like to credit the Photo, here are some ways you can do so
Text Link
video Link
<span class="text-link">
<span>
<a target="_blank" href=https://pikwizard.com/video/dynamic-financial-data-processing-animation-on-grid/3a7006f974e289c69dfc8aacaaed1ae0/>PikWizard</a>
</span>
</span>
<span class="image-link">
<span
style="margin: 0 0 20px 0; display: inline-block; vertical-align: middle; width: 100%;"
>
<a
target="_blank"
href="https://pikwizard.com/video/dynamic-financial-data-processing-animation-on-grid/3a7006f974e289c69dfc8aacaaed1ae0/"
style="text-decoration: none; font-size: 10px; margin: 0;"
>
<video controls style="width: 100%; margin: 0;">
<source src="https://player.vimeo.com/progressive_redirect/playback/907548270/rendition/240p/file.mp4?loc=external&oauth2_token_id=1223210874&signature=f7d01c42f7adc645408de465ea10e24733acb35254b20ce3a6bac03496e4a516" type="video/mp4"
poster="https://pikwizard.com/pw/medium/3a7006f974e289c69dfc8aacaaed1ae0.jpg"/>
Your browser does not support the video tag.
</video>
<p style="font-size: 12px; margin: 0;">PikWizard</p>
</a>
</span>
</span>
Free (free of charge)
Free for personal and commercial use.
Author: Awesome Content