
- Home >
- Stock Videos >
- Dynamic Financial Data Processing Visualization in Digital Interface
Dynamic Financial Data Processing Visualization in Digital Interface Video
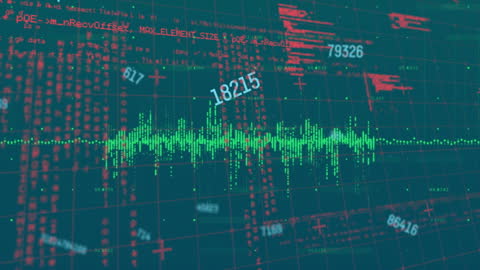
Simulation illustrating complex financial data with numeric codes and waveforms, representing data analytics and computational algorithms. Ideal for presentations on financial technology, data science demonstrations, and educational materials highlighting stock market analyses and algorithmic trading.

downloads
Tags:
More
Credit Photo
If you would like to credit the Photo, here are some ways you can do so
Text Link
video Link
<span class="text-link">
<span>
<a target="_blank" href=https://pikwizard.com/video/dynamic-financial-data-processing-visualization-in-digital-interface/c2a471ad0a22d24edda438d241386658/>PikWizard</a>
</span>
</span>
<span class="image-link">
<span
style="margin: 0 0 20px 0; display: inline-block; vertical-align: middle; width: 100%;"
>
<a
target="_blank"
href="https://pikwizard.com/video/dynamic-financial-data-processing-visualization-in-digital-interface/c2a471ad0a22d24edda438d241386658/"
style="text-decoration: none; font-size: 10px; margin: 0;"
>
<video controls style="width: 100%; margin: 0;">
<source src="https://player.vimeo.com/progressive_redirect/playback/768323611/rendition/240p/file.mp4?loc=external&oauth2_token_id=1223210874&signature=fc6d3051a4eb7afbc30fa3105f50db9f9ff87c90f12dcb18ca3abcfa29a9f049" type="video/mp4"
poster="https://pikwizard.com/pw/medium/c2a471ad0a22d24edda438d241386658.jpg"/>
Your browser does not support the video tag.
</video>
<p style="font-size: 12px; margin: 0;">PikWizard</p>
</a>
</span>
</span>
Free (free of charge)
Free for personal and commercial use.
Author: Awesome Content