
- Home >
- Stock Videos >
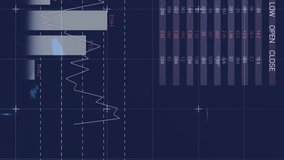
- Dynamic Financial Data Processing Visualization on Blue Background
Dynamic Financial Data Processing Visualization on Blue Background Video

Vibrant visualization of financial data processing and statistics displayed on a digital grid backdrop, representing global business connectivity and technology. Suitable for illustrating concepts in fintech, data analysis presentations, or corporate finance board meetings.
Powered by  - Get 15% off with code: PIKWIZARD15


downloads
Tags:
More
Credit Photo
If you would like to credit the Photo, here are some ways you can do so
Text Link
video Link
<span class="text-link">
<span>
<a target="_blank" href=https://pikwizard.com/video/dynamic-financial-data-processing-visualization-on-blue-background/c13e6dcb334a61d26eaa1249d042d5be/>PikWizard</a>
</span>
</span>
<span class="image-link">
<span
style="margin: 0 0 20px 0; display: inline-block; vertical-align: middle; width: 100%;"
>
<a
target="_blank"
href="https://pikwizard.com/video/dynamic-financial-data-processing-visualization-on-blue-background/c13e6dcb334a61d26eaa1249d042d5be/"
style="text-decoration: none; font-size: 10px; margin: 0;"
>
<video controls style="width: 100%; margin: 0;">
<source src="https://player.vimeo.com/progressive_redirect/playback/717562871/rendition/240p/file.mp4?loc=external&oauth2_token_id=1223210874&signature=b1d4efeb9f90875162bc55bf163eebb622a57791677efd606409d1436ce3bdf8" type="video/mp4"
poster="https://pikwizard.com/pw/medium/c13e6dcb334a61d26eaa1249d042d5be.jpg"/>
Your browser does not support the video tag.
</video>
<p style="font-size: 12px; margin: 0;">PikWizard</p>
</a>
</span>
</span>
Free (free of charge)
Free for personal and commercial use.
Author: Awesome Content