
- Home >
- Stock Videos >
- Dynamic Financial Data Processing Visualization
Dynamic Financial Data Processing Visualization Video
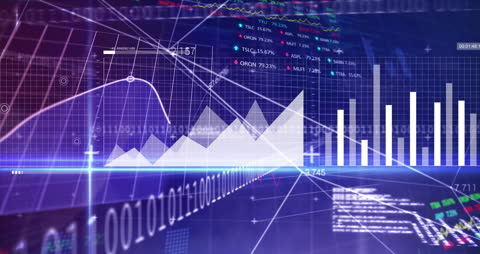
Futuristic representation showing dynamic stock market charts and financial data processing against a dark background. Useful for materials focused on financial technology, data analytics, or digital finance education, emphasizing modern improvements and technological developments in incisive trading landscapes.

downloads
Tags:
More
Credit Photo
If you would like to credit the Photo, here are some ways you can do so
Text Link
video Link
<span class="text-link">
<span>
<a target="_blank" href=https://pikwizard.com/video/dynamic-financial-data-processing-visualization/0a4668070d340dbd44f4afb93488b933/>PikWizard</a>
</span>
</span>
<span class="image-link">
<span
style="margin: 0 0 20px 0; display: inline-block; vertical-align: middle; width: 100%;"
>
<a
target="_blank"
href="https://pikwizard.com/video/dynamic-financial-data-processing-visualization/0a4668070d340dbd44f4afb93488b933/"
style="text-decoration: none; font-size: 10px; margin: 0;"
>
<video controls style="width: 100%; margin: 0;">
<source src="https://player.vimeo.com/progressive_redirect/playback/839230860/rendition/240p/file.mp4?loc=external&oauth2_token_id=1223210874&signature=56b8ffa56adf31018dddad87c0a6472b8a4acf19f8bdeeb08fc1490e27f20696" type="video/mp4"
poster="https://pikwizard.com/pw/medium/0a4668070d340dbd44f4afb93488b933.jpg"/>
Your browser does not support the video tag.
</video>
<p style="font-size: 12px; margin: 0;">PikWizard</p>
</a>
</span>
</span>
Free (free of charge)
Free for personal and commercial use.
Author: Awesome Content