
- Home >
- Stock Videos >
- Dynamic Financial Data Visualization and Graphs
Dynamic Financial Data Visualization and Graphs Video
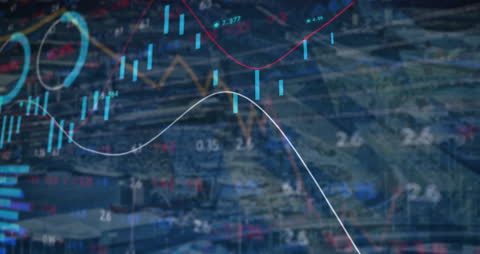
This video of financial data and graphs represents digital technology and analytics in the economy. Suited for articles discussing market trends, investments, or advancements in financial technology. Ideal for use in financial planning brochures or educational materials on economy.

downloads
Tags:
More
Credit Photo
If you would like to credit the Photo, here are some ways you can do so
Text Link
video Link
<span class="text-link">
<span>
<a target="_blank" href=https://pikwizard.com/video/dynamic-financial-data-visualization-and-graphs/67b655a7341c292db3cd78d302f69a33/>PikWizard</a>
</span>
</span>
<span class="image-link">
<span
style="margin: 0 0 20px 0; display: inline-block; vertical-align: middle; width: 100%;"
>
<a
target="_blank"
href="https://pikwizard.com/video/dynamic-financial-data-visualization-and-graphs/67b655a7341c292db3cd78d302f69a33/"
style="text-decoration: none; font-size: 10px; margin: 0;"
>
<video controls style="width: 100%; margin: 0;">
<source src="https://player.vimeo.com/progressive_redirect/playback/718534109/rendition/240p/file.mp4?loc=external&oauth2_token_id=1223210874&signature=4bdc853dbc11c1149faf9f16f66c00b061d95d8cba8245756bf9e7ffa4c7b52f" type="video/mp4"
poster="https://pikwizard.com/pw/medium/67b655a7341c292db3cd78d302f69a33.jpg"/>
Your browser does not support the video tag.
</video>
<p style="font-size: 12px; margin: 0;">PikWizard</p>
</a>
</span>
</span>
Free (free of charge)
Free for personal and commercial use.
Author: Awesome Content