
- Home >
- Stock Videos >
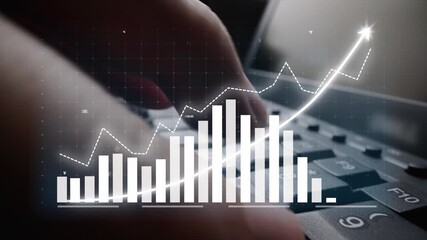
- Dynamic Financial Data Visualization on a Dark Background
Dynamic Financial Data Visualization on a Dark Background Video

This visualization presents vibrant graphs and analytical elements set on a dark background, highlighting dynamic changes in financial data over time. Suitable for use in presentations related to business analysis or financial investments, as well as in digital marketing material focused on finance technology and data analytics. Perfect for projects aiming to illustrate concepts in modern banking and economic forecasting.
Powered by 


downloads
Tags:
More
Credit Photo
If you would like to credit the Photo, here are some ways you can do so
Text Link
video Link
<span class="text-link">
<span>
<a target="_blank" href=https://pikwizard.com/video/dynamic-financial-data-visualization-on-a-dark-background/f1f30527064c3d1139279b6dd8a4125a/>PikWizard</a>
</span>
</span>
<span class="image-link">
<span
style="margin: 0 0 20px 0; display: inline-block; vertical-align: middle; width: 100%;"
>
<a
target="_blank"
href="https://pikwizard.com/video/dynamic-financial-data-visualization-on-a-dark-background/f1f30527064c3d1139279b6dd8a4125a/"
style="text-decoration: none; font-size: 10px; margin: 0;"
>
<video controls style="width: 100%; margin: 0;">
<source src="https://player.vimeo.com/progressive_redirect/playback/923216722/rendition/240p/file.mp4?loc=external&oauth2_token_id=1223210874&signature=dec47343c74f1f184a5378d79b2c356af7e5801801a8dc697b9633c5396c2b81" type="video/mp4"
poster="https://pikwizard.com/pw/medium/f1f30527064c3d1139279b6dd8a4125a.jpg"/>
Your browser does not support the video tag.
</video>
<p style="font-size: 12px; margin: 0;">PikWizard</p>
</a>
</span>
</span>
Free (free of charge)
Free for personal and commercial use.
Author: Awesome Content