
- Home >
- Stock Videos >
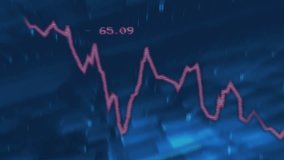
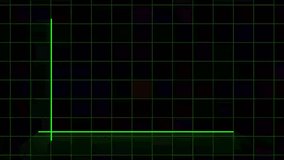
- Dynamic Financial Data Visualization on Dark Grid
Dynamic Financial Data Visualization on Dark Grid Video
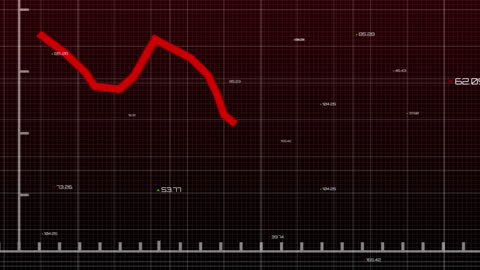
Illustrates financial data projection through animated graph over dark grid background, useful for economic analysis in business presentations or technology demonstrations.
Powered by  - Get 15% off with code: PIKWIZARD15


downloads
Tags:
More
Credit Photo
If you would like to credit the Photo, here are some ways you can do so
Text Link
video Link
<span class="text-link">
<span>
<a target="_blank" href=https://pikwizard.com/video/dynamic-financial-data-visualization-on-dark-grid/741497fde527bcb05d4d533478bda93b/>PikWizard</a>
</span>
</span>
<span class="image-link">
<span
style="margin: 0 0 20px 0; display: inline-block; vertical-align: middle; width: 100%;"
>
<a
target="_blank"
href="https://pikwizard.com/video/dynamic-financial-data-visualization-on-dark-grid/741497fde527bcb05d4d533478bda93b/"
style="text-decoration: none; font-size: 10px; margin: 0;"
>
<video controls style="width: 100%; margin: 0;">
<source src="https://player.vimeo.com/progressive_redirect/playback/717008058/rendition/240p/file.mp4?loc=external&oauth2_token_id=1223210874&signature=efb0430171482815fdf0f3608fdf081d534478e4b4f7368a00b5911d7c99bbec" type="video/mp4"
poster="https://pikwizard.com/pw/medium/741497fde527bcb05d4d533478bda93b.jpg"/>
Your browser does not support the video tag.
</video>
<p style="font-size: 12px; margin: 0;">PikWizard</p>
</a>
</span>
</span>
Free (free of charge)
Free for personal and commercial use.
Author: Awesome Content