
- Home >
- Stock Videos >
- Dynamic Financial Data Visualization on Digital Dashboard
Dynamic Financial Data Visualization on Digital Dashboard Video

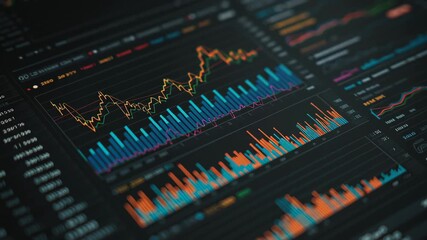
This animation illustrates a dynamic and complex concept of financial data visualizations displayed on a digital dashboard. With numbers, graphs, and moving data patterns, it embodies insights dialysis and market trends analysis. Useful for presentations on expert-level finance analytics, stock market strategies, and predictive algorithms in business finance lectures or product promotions involving fintech innovations.
Powered by 


downloads
Tags:
More
Credit Photo
If you would like to credit the Photo, here are some ways you can do so
Text Link
video Link
<span class="text-link">
<span>
<a target="_blank" href=https://pikwizard.com/video/dynamic-financial-data-visualization-on-digital-dashboard/f131d1ead890863a0feb1b984555ba73/>PikWizard</a>
</span>
</span>
<span class="image-link">
<span
style="margin: 0 0 20px 0; display: inline-block; vertical-align: middle; width: 100%;"
>
<a
target="_blank"
href="https://pikwizard.com/video/dynamic-financial-data-visualization-on-digital-dashboard/f131d1ead890863a0feb1b984555ba73/"
style="text-decoration: none; font-size: 10px; margin: 0;"
>
<video controls style="width: 100%; margin: 0;">
<source src="https://player.vimeo.com/progressive_redirect/playback/767126694/rendition/240p/file.mp4?loc=external&oauth2_token_id=1223210874&signature=4dde1c8e5bee2dec48f40506c547d4de5e881300c54e24bdd3b55ff3c9fdba27" type="video/mp4"
poster="https://pikwizard.com/pw/medium/f131d1ead890863a0feb1b984555ba73.jpg"/>
Your browser does not support the video tag.
</video>
<p style="font-size: 12px; margin: 0;">PikWizard</p>
</a>
</span>
</span>
Free (free of charge)
Free for personal and commercial use.
Author: Awesome Content