
- Home >
- Stock Videos >
- Dynamic Financial Data Visualization on Digital Graph
Dynamic Financial Data Visualization on Digital Graph Video
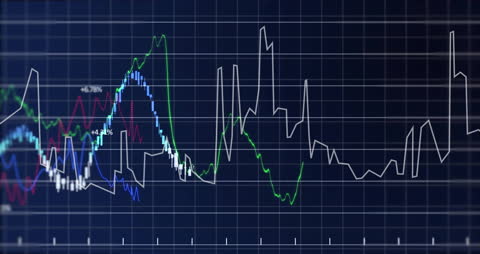
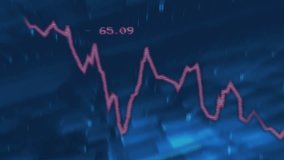
This visual represents dynamic financial data depicted through an animated graph, showcasing various economic trends with lines in different colors against a black background. Ideal for illustrating concepts related to global finance, stock market analysis, and digital data processing. Useful for business presentations, financial reports, and educational purposes teaching economic analytics.
Powered by  - Get 15% off with code: PIKWIZARD15


downloads
Tags:
More
Credit Photo
If you would like to credit the Photo, here are some ways you can do so
Text Link
video Link
<span class="text-link">
<span>
<a target="_blank" href=https://pikwizard.com/video/dynamic-financial-data-visualization-on-digital-graph/aa6301f04f32d970aa99869291bd3816/>PikWizard</a>
</span>
</span>
<span class="image-link">
<span
style="margin: 0 0 20px 0; display: inline-block; vertical-align: middle; width: 100%;"
>
<a
target="_blank"
href="https://pikwizard.com/video/dynamic-financial-data-visualization-on-digital-graph/aa6301f04f32d970aa99869291bd3816/"
style="text-decoration: none; font-size: 10px; margin: 0;"
>
<video controls style="width: 100%; margin: 0;">
<source src="https://player.vimeo.com/progressive_redirect/playback/892123407/rendition/240p/file.mp4?loc=external&oauth2_token_id=1223210874&signature=e01178e0242767a5c132ec29f0777c7c42362e46bb744907fa0f1583296445b0" type="video/mp4"
poster="https://pikwizard.com/pw/medium/aa6301f04f32d970aa99869291bd3816.jpg"/>
Your browser does not support the video tag.
</video>
<p style="font-size: 12px; margin: 0;">PikWizard</p>
</a>
</span>
</span>
Free (free of charge)
Free for personal and commercial use.
Author: Awesome Content