
- Home >
- Stock Videos >
- Dynamic Financial Data Visualization on High-Tech Dashboard
Dynamic Financial Data Visualization on High-Tech Dashboard Video
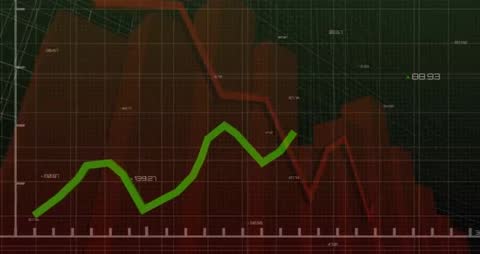
Digital presentation of financial analytics features red translucent bars and a prominent green line graph, ideal for illustrating financial trends or economic growth. Perfect for use in finance presentations, business reports, or investment analysis articles highlighting key movements in performance metrics. Suitable for technology companies focusing on data-driven solutions.
Powered by  - Get 15% off with code: PIKWIZARD15


downloads
Tags:
More
Credit Photo
If you would like to credit the Photo, here are some ways you can do so
Text Link
video Link
<span class="text-link">
<span>
<a target="_blank" href=https://pikwizard.com/video/dynamic-financial-data-visualization-on-high-tech-dashboard/856c1a415d7c3e1ca4cba6f75857395a/>PikWizard</a>
</span>
</span>
<span class="image-link">
<span
style="margin: 0 0 20px 0; display: inline-block; vertical-align: middle; width: 100%;"
>
<a
target="_blank"
href="https://pikwizard.com/video/dynamic-financial-data-visualization-on-high-tech-dashboard/856c1a415d7c3e1ca4cba6f75857395a/"
style="text-decoration: none; font-size: 10px; margin: 0;"
>
<video controls style="width: 100%; margin: 0;">
<source src="https://player.vimeo.com/progressive_redirect/playback/1078028619/rendition/240p/file.mp4?loc=external&oauth2_token_id=1223210874&signature=fb6465c11a5e3d19017c00021aaccfa6118b470963717a770586def237cce1a2" type="video/mp4"
poster="https://pikwizard.com/pw/medium/856c1a415d7c3e1ca4cba6f75857395a.jpg"/>
Your browser does not support the video tag.
</video>
<p style="font-size: 12px; margin: 0;">PikWizard</p>
</a>
</span>
</span>
Free (free of charge)
Free for personal and commercial use.
Author: Awesome Content