
- Home >
- Stock Videos >
- Dynamic Financial Data Visualization with Charts and Graphs
Dynamic Financial Data Visualization with Charts and Graphs Video
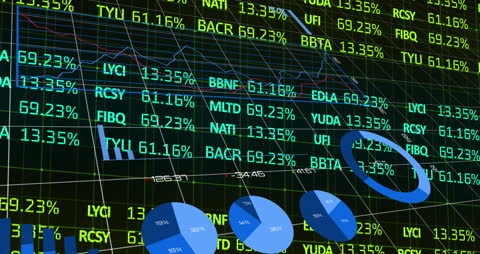
Visually represents global financial data, using statistical charts and graphs overlaid on a world map. Perfect for illustrating concepts in economics, business analytics, or innovations in financial technology. Useful for websites or presentations related to finance, data visualization methods, or tech-driven economic solutions.
Powered by 


downloads
Tags:
More
Credit Photo
If you would like to credit the Photo, here are some ways you can do so
Text Link
video Link
<span class="text-link">
<span>
<a target="_blank" href=https://pikwizard.com/video/dynamic-financial-data-visualization-with-charts-and-graphs/7e54dd69cf09665c99fe6c84e2e5956b/>PikWizard</a>
</span>
</span>
<span class="image-link">
<span
style="margin: 0 0 20px 0; display: inline-block; vertical-align: middle; width: 100%;"
>
<a
target="_blank"
href="https://pikwizard.com/video/dynamic-financial-data-visualization-with-charts-and-graphs/7e54dd69cf09665c99fe6c84e2e5956b/"
style="text-decoration: none; font-size: 10px; margin: 0;"
>
<video controls style="width: 100%; margin: 0;">
<source src="https://player.vimeo.com/progressive_redirect/playback/717562940/rendition/360p/file.mp4?loc=external&oauth2_token_id=1223210874&signature=5d2c4001b36a1261218fe69aa985a4e6005907b5ffb37765e3444dacf51d04d9" type="video/mp4"
poster="https://pikwizard.com/pw/medium/7e54dd69cf09665c99fe6c84e2e5956b.jpg"/>
Your browser does not support the video tag.
</video>
<p style="font-size: 12px; margin: 0;">PikWizard</p>
</a>
</span>
</span>
Free (free of charge)
Free for personal and commercial use.
Author: Awesome Content