
- Home >
- Stock Videos >
- Dynamic Financial Data Visualization with Graph Line
Dynamic Financial Data Visualization with Graph Line Video
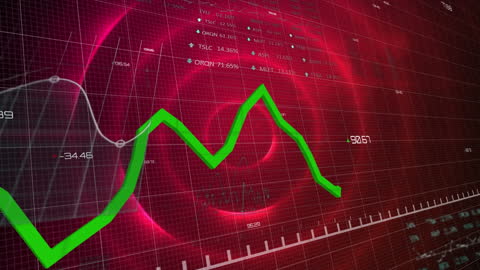
Vibrant financial data visualization showing fluctuating green graph line over a digital grid. Suitable for presentations, financial reports, or articles focused on economic trends, analytics insight and corporate strategy.

downloads
Tags:
More
Credit Photo
If you would like to credit the Photo, here are some ways you can do so
Text Link
video Link
<span class="text-link">
<span>
<a target="_blank" href=https://pikwizard.com/video/dynamic-financial-data-visualization-with-graph-line/b5603aeb7d6eba8cc82ff4aff0f98031/>PikWizard</a>
</span>
</span>
<span class="image-link">
<span
style="margin: 0 0 20px 0; display: inline-block; vertical-align: middle; width: 100%;"
>
<a
target="_blank"
href="https://pikwizard.com/video/dynamic-financial-data-visualization-with-graph-line/b5603aeb7d6eba8cc82ff4aff0f98031/"
style="text-decoration: none; font-size: 10px; margin: 0;"
>
<video controls style="width: 100%; margin: 0;">
<source src="https://player.vimeo.com/progressive_redirect/playback/774030582/rendition/240p/file.mp4?loc=external&oauth2_token_id=1223210874&signature=c5bfc0762d32673a6f3b52f29d9ce6a2001804ebb65c10cffddad53076485519" type="video/mp4"
poster="https://pikwizard.com/pw/medium/b5603aeb7d6eba8cc82ff4aff0f98031.jpg"/>
Your browser does not support the video tag.
</video>
<p style="font-size: 12px; margin: 0;">PikWizard</p>
</a>
</span>
</span>
Free (free of charge)
Free for personal and commercial use.
Author: Awesome Content