
- Home >
- Stock Videos >
- Dynamic Financial Data Visualization with Graphs and Maps
Dynamic Financial Data Visualization with Graphs and Maps Video
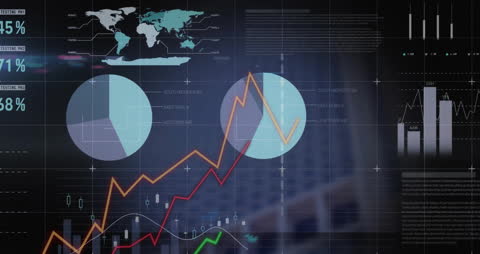
Dynamic display of financial data with charts and world maps indicates real-time data analysis. Useful for presentations, illustrating financial concepts, and enhancing multimedia content focused on technology or stock markets.

downloads
Tags:
More
Credit Photo
If you would like to credit the Photo, here are some ways you can do so
Text Link
video Link
<span class="text-link">
<span>
<a target="_blank" href=https://pikwizard.com/video/dynamic-financial-data-visualization-with-graphs-and-maps/318439077efefeba8a702f4658fffdc4/>PikWizard</a>
</span>
</span>
<span class="image-link">
<span
style="margin: 0 0 20px 0; display: inline-block; vertical-align: middle; width: 100%;"
>
<a
target="_blank"
href="https://pikwizard.com/video/dynamic-financial-data-visualization-with-graphs-and-maps/318439077efefeba8a702f4658fffdc4/"
style="text-decoration: none; font-size: 10px; margin: 0;"
>
<video controls style="width: 100%; margin: 0;">
<source src="https://player.vimeo.com/progressive_redirect/playback/920890117/rendition/240p/file.mp4?loc=external&oauth2_token_id=1223210874&signature=72d3d6b49e37d7d56e3f25b9c840e4586852cda4f79520352bb945dc72ce90f0" type="video/mp4"
poster="https://pikwizard.com/pw/medium/318439077efefeba8a702f4658fffdc4.jpg"/>
Your browser does not support the video tag.
</video>
<p style="font-size: 12px; margin: 0;">PikWizard</p>
</a>
</span>
</span>
Free (free of charge)
Free for personal and commercial use.
Author: Awesome Content