
- Home >
- Stock Videos >
- Dynamic Financial Data Visualization with Rising Trend
Dynamic Financial Data Visualization with Rising Trend Video
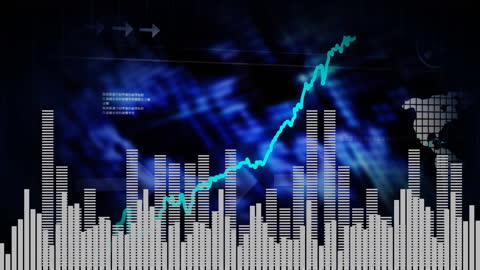
This video showcases a dynamic visualization of financial data with a rising trend displayed through bar columns and a line graph overlay. It represents concepts such as economic growth, market analysis, and digital financial forecasting. Ideal for use in financial reports, business presentations, and investment seminars to emphasize positive financial performance and market trends.

downloads
Tags:
More
Credit Photo
If you would like to credit the Photo, here are some ways you can do so
Text Link
video Link
<span class="text-link">
<span>
<a target="_blank" href=https://pikwizard.com/video/dynamic-financial-data-visualization-with-rising-trend/149c49f4e9f9028dcc69a6a62f742abc/>PikWizard</a>
</span>
</span>
<span class="image-link">
<span
style="margin: 0 0 20px 0; display: inline-block; vertical-align: middle; width: 100%;"
>
<a
target="_blank"
href="https://pikwizard.com/video/dynamic-financial-data-visualization-with-rising-trend/149c49f4e9f9028dcc69a6a62f742abc/"
style="text-decoration: none; font-size: 10px; margin: 0;"
>
<video controls style="width: 100%; margin: 0;">
<source src="https://player.vimeo.com/progressive_redirect/playback/716318083/rendition/240p/file.mp4?loc=external&oauth2_token_id=1223210874&signature=0fec7b424264cfb52609a07e4de85da502aadaee5517fde1bb238712dab2abe7" type="video/mp4"
poster="https://pikwizard.com/pw/medium/149c49f4e9f9028dcc69a6a62f742abc.jpg"/>
Your browser does not support the video tag.
</video>
<p style="font-size: 12px; margin: 0;">PikWizard</p>
</a>
</span>
</span>
Free (free of charge)
Free for personal and commercial use.
Author: Awesome Content