
- Home >
- Stock Videos >
- Dynamic Financial Data with Rising and Falling Graphs
Dynamic Financial Data with Rising and Falling Graphs Video
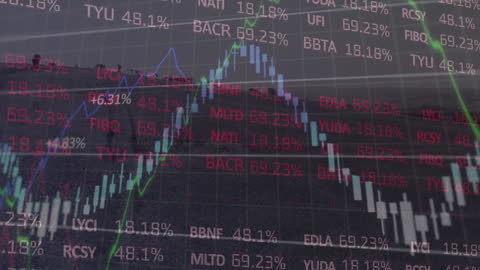
This representation of financial data features fluctuating graphs and numbers, conveying market trends and economic dynamics. Useful for illustrating economics, investment strategies, or financial technology topics. Ideal for website backgrounds, presentation decks, and financial articles emphasizing data-driven analysis and decision making.
Powered by 


downloads
Tags:
More
Credit Photo
If you would like to credit the Photo, here are some ways you can do so
Text Link
video Link
<span class="text-link">
<span>
<a target="_blank" href=https://pikwizard.com/video/dynamic-financial-data-with-rising-and-falling-graphs/1d04523e7beda229a62caf3f73457ff8/>PikWizard</a>
</span>
</span>
<span class="image-link">
<span
style="margin: 0 0 20px 0; display: inline-block; vertical-align: middle; width: 100%;"
>
<a
target="_blank"
href="https://pikwizard.com/video/dynamic-financial-data-with-rising-and-falling-graphs/1d04523e7beda229a62caf3f73457ff8/"
style="text-decoration: none; font-size: 10px; margin: 0;"
>
<video controls style="width: 100%; margin: 0;">
<source src="https://player.vimeo.com/progressive_redirect/playback/758892302/rendition/240p/file.mp4?loc=external&oauth2_token_id=1223210874&signature=793221d10073c84bc70a1d2fc9ac7bb17dbe03c0e68034afba53f468243d2bdd" type="video/mp4"
poster="https://pikwizard.com/pw/medium/1d04523e7beda229a62caf3f73457ff8.jpg"/>
Your browser does not support the video tag.
</video>
<p style="font-size: 12px; margin: 0;">PikWizard</p>
</a>
</span>
</span>
Free (free of charge)
Free for personal and commercial use.
Author: Awesome Content