
- Home >
- Stock Videos >
- Dynamic Financial Graph Tracking Increasing Trend
Dynamic Financial Graph Tracking Increasing Trend Video
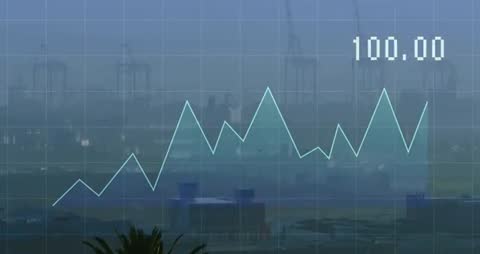
This video showcases a dynamic turquoise line graph illustrating a rising trend with an animated label indicating the numeric value of 100.00. The background subtly reveals an industrial or port setting, adding context to financial or market activity analysis. Useful for presentations on business performance metrics, economic trends, or financial forecasting insights.
Powered by 


downloads
Tags:
More
Credit Photo
If you would like to credit the Photo, here are some ways you can do so
Text Link
video Link
<span class="text-link">
<span>
<a target="_blank" href=https://pikwizard.com/video/dynamic-financial-graph-tracking-increasing-trend/704022785a5857ced3f5b5e6921ceb05/>PikWizard</a>
</span>
</span>
<span class="image-link">
<span
style="margin: 0 0 20px 0; display: inline-block; vertical-align: middle; width: 100%;"
>
<a
target="_blank"
href="https://pikwizard.com/video/dynamic-financial-graph-tracking-increasing-trend/704022785a5857ced3f5b5e6921ceb05/"
style="text-decoration: none; font-size: 10px; margin: 0;"
>
<video controls style="width: 100%; margin: 0;">
<source src="https://player.vimeo.com/progressive_redirect/playback/1131515441/rendition/240p/file.mp4?loc=external&oauth2_token_id=1223210874&signature=2c520eda70527d94f1869524f6444bded3b6317a4f67ade6dc8970a8b820985a" type="video/mp4"
poster="https://pikwizard.com/pw/medium/704022785a5857ced3f5b5e6921ceb05.jpg"/>
Your browser does not support the video tag.
</video>
<p style="font-size: 12px; margin: 0;">PikWizard</p>
</a>
</span>
</span>
Free (free of charge)
Free for personal and commercial use.
Author: Awesome Content