
- Home >
- Stock Videos >
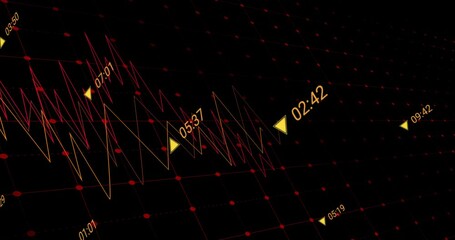
- Dynamic Financial Graph with Data Points and Time Markers
Dynamic Financial Graph with Data Points and Time Markers Video
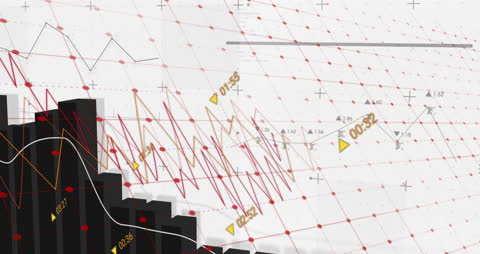
This video visually represents complex financial data with graph lines and bar charts, enriched with dynamic time markers and fluctuating figures. Perfect for use in financial reports, investment analysis presentations, and educational materials that focus on market trends, trading dynamics, or economic forecasting.
Powered by 


downloads
Tags:
More
Credit Photo
If you would like to credit the Photo, here are some ways you can do so
Text Link
video Link
<span class="text-link">
<span>
<a target="_blank" href=https://pikwizard.com/video/dynamic-financial-graph-with-data-points-and-time-markers/ac8ded18e1bda33c44e56b229efdbf97/>PikWizard</a>
</span>
</span>
<span class="image-link">
<span
style="margin: 0 0 20px 0; display: inline-block; vertical-align: middle; width: 100%;"
>
<a
target="_blank"
href="https://pikwizard.com/video/dynamic-financial-graph-with-data-points-and-time-markers/ac8ded18e1bda33c44e56b229efdbf97/"
style="text-decoration: none; font-size: 10px; margin: 0;"
>
<video controls style="width: 100%; margin: 0;">
<source src="https://player.vimeo.com/progressive_redirect/playback/989224373/rendition/240p/file.mp4?loc=external&oauth2_token_id=1223210874&signature=caeb0daee7977eb801eb233e4c2a46025e404bac129e360cb5379a4ddbde37d1" type="video/mp4"
poster="https://pikwizard.com/pw/medium/ac8ded18e1bda33c44e56b229efdbf97.jpg"/>
Your browser does not support the video tag.
</video>
<p style="font-size: 12px; margin: 0;">PikWizard</p>
</a>
</span>
</span>
Free (free of charge)
Free for personal and commercial use.
Author: Awesome Content