
- Home >
- Stock Videos >
- Dynamic Financial Graph with Real-Time Price Fluctuation
Dynamic Financial Graph with Real-Time Price Fluctuation Video
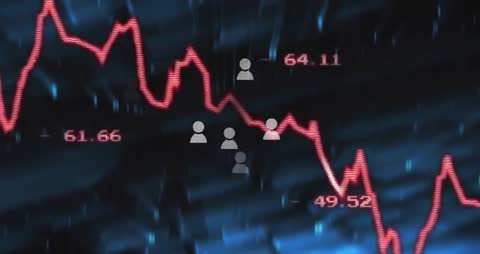
Real-time fluctuating financial graph underscores economic volatility, useful for representing financial market trends, like stocks or cryptocurrencies. Colors and movement highlight dynamic nature of data and modern technological analytics.
Powered by 


downloads
Tags:
More
Credit Photo
If you would like to credit the Photo, here are some ways you can do so
Text Link
video Link
<span class="text-link">
<span>
<a target="_blank" href=https://pikwizard.com/video/dynamic-financial-graph-with-real-time-price-fluctuation/61f121c948c7b79a91c3d87312404a1c/>PikWizard</a>
</span>
</span>
<span class="image-link">
<span
style="margin: 0 0 20px 0; display: inline-block; vertical-align: middle; width: 100%;"
>
<a
target="_blank"
href="https://pikwizard.com/video/dynamic-financial-graph-with-real-time-price-fluctuation/61f121c948c7b79a91c3d87312404a1c/"
style="text-decoration: none; font-size: 10px; margin: 0;"
>
<video controls style="width: 100%; margin: 0;">
<source src="https://player.vimeo.com/progressive_redirect/playback/1088678047/rendition/240p/file.mp4?loc=external&oauth2_token_id=1223210874&signature=57f2083c378c0c9efce30e997ce5bee0db8096795dcd7c5fd5f2027a9228e74e" type="video/mp4"
poster="https://pikwizard.com/pw/medium/61f121c948c7b79a91c3d87312404a1c.jpg"/>
Your browser does not support the video tag.
</video>
<p style="font-size: 12px; margin: 0;">PikWizard</p>
</a>
</span>
</span>
Free (free of charge)
Free for personal and commercial use.
Author: Awesome Content
Similar Free Stock Videos
Loading...