
- Home >
- Stock Videos >
- Dynamic Financial Graphs and Data Animation
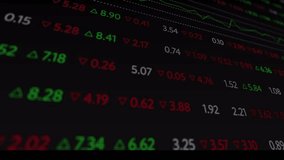
Dynamic Financial Graphs and Data Animation Video
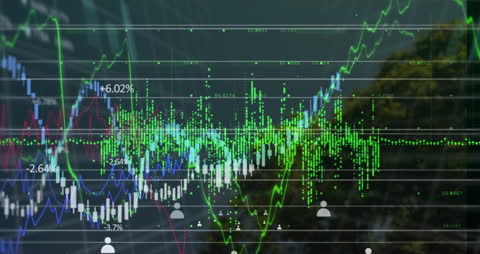
Shows multiple dynamic graph lines and data dots visualizing financial statistics and processing. Ideal for representing concepts of global business analytics, investment trends, stock market analysis, and technological developments in finance. Useful for presentations, educational materials, and business reporting applications to convey complex data insights effectively.
Powered by  - Get 15% off with code: PIKWIZARD15


downloads
Tags:
More
Credit Photo
If you would like to credit the Photo, here are some ways you can do so
Text Link
video Link
<span class="text-link">
<span>
<a target="_blank" href=https://pikwizard.com/video/dynamic-financial-graphs-and-data-animation/a976f5719d443f7fb4f6491582ffa6e6/>PikWizard</a>
</span>
</span>
<span class="image-link">
<span
style="margin: 0 0 20px 0; display: inline-block; vertical-align: middle; width: 100%;"
>
<a
target="_blank"
href="https://pikwizard.com/video/dynamic-financial-graphs-and-data-animation/a976f5719d443f7fb4f6491582ffa6e6/"
style="text-decoration: none; font-size: 10px; margin: 0;"
>
<video controls style="width: 100%; margin: 0;">
<source src="https://player.vimeo.com/progressive_redirect/playback/788693429/rendition/240p/file.mp4?loc=external&oauth2_token_id=1223210874&signature=3a6a94a8e0d1ffa8017363a9969ab8c1dfedfd53ac7a896239748daf58c6f57f" type="video/mp4"
poster="https://pikwizard.com/pw/medium/a976f5719d443f7fb4f6491582ffa6e6.jpg"/>
Your browser does not support the video tag.
</video>
<p style="font-size: 12px; margin: 0;">PikWizard</p>
</a>
</span>
</span>
Free (free of charge)
Free for personal and commercial use.
Author: Awesome Content