
- Home >
- Stock Videos >
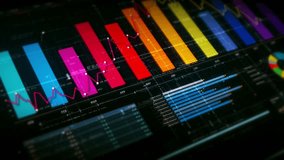
- Dynamic Financial Graphs and Data with Digital Glow
Dynamic Financial Graphs and Data with Digital Glow Video

Illustrates a vibrant display of financial graphs and data merged with a digital glow. Ideal for presentations about finance, investment strategies, and global economics, as well as articles on market analysis and technological advancements in fiscal management.
Powered by  - Get 15% off with code: PIKWIZARD15


downloads
Tags:
More
Credit Photo
If you would like to credit the Photo, here are some ways you can do so
Text Link
video Link
<span class="text-link">
<span>
<a target="_blank" href=https://pikwizard.com/video/dynamic-financial-graphs-and-data-with-digital-glow/ac06329429a26a4e1c7529afbd9529bc/>PikWizard</a>
</span>
</span>
<span class="image-link">
<span
style="margin: 0 0 20px 0; display: inline-block; vertical-align: middle; width: 100%;"
>
<a
target="_blank"
href="https://pikwizard.com/video/dynamic-financial-graphs-and-data-with-digital-glow/ac06329429a26a4e1c7529afbd9529bc/"
style="text-decoration: none; font-size: 10px; margin: 0;"
>
<video controls style="width: 100%; margin: 0;">
<source src="https://player.vimeo.com/progressive_redirect/playback/758934826/rendition/240p/file.mp4?loc=external&oauth2_token_id=1223210874&signature=3c2d27e12f959e72ec014298dcf2b0cce9cf0322c52438900fdc826730f17048" type="video/mp4"
poster="https://pikwizard.com/pw/medium/ac06329429a26a4e1c7529afbd9529bc.jpg"/>
Your browser does not support the video tag.
</video>
<p style="font-size: 12px; margin: 0;">PikWizard</p>
</a>
</span>
</span>
Free (free of charge)
Free for personal and commercial use.
Author: Awesome Content