
- Home >
- Stock Videos >
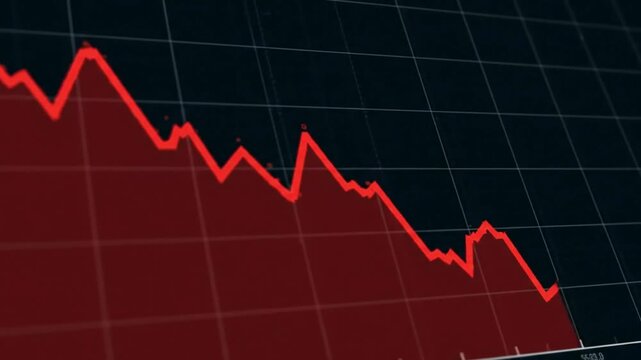
- Dynamic Financial Graphs and Virus Cells Illustrating Market Impact
Dynamic Financial Graphs and Virus Cells Illustrating Market Impact Video
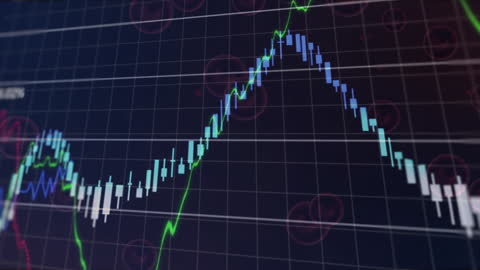
This visual representation illustrates the intersection of finance and healthcare during the COVID-19 pandemic. Ideal for use in articles about market changes, financial analysis during global crises, economic impacts of pandemics, or in healthcare-related economic studies. It suits presentations on business fluctuations caused by healthcare issues.
Powered by 


0
downloads
downloads
Tags:
More
Credit Photo
If you would like to credit the Photo, here are some ways you can do so
Text Link
video Link
<span class="text-link">
<span>
<a target="_blank" href=https://pikwizard.com/video/dynamic-financial-graphs-and-virus-cells-illustrating-market-impact/42c834ff0e18b64478d5fdebea61a562/>PikWizard</a>
</span>
</span>
<span class="image-link">
<span
style="margin: 0 0 20px 0; display: inline-block; vertical-align: middle; width: 100%;"
>
<a
target="_blank"
href="https://pikwizard.com/video/dynamic-financial-graphs-and-virus-cells-illustrating-market-impact/42c834ff0e18b64478d5fdebea61a562/"
style="text-decoration: none; font-size: 10px; margin: 0;"
>
<video controls style="width: 100%; margin: 0;">
<source src="https://player.vimeo.com/progressive_redirect/playback/908023203/rendition/240p/file.mp4?loc=external&oauth2_token_id=1223210874&signature=6b61695ae4da65c02d3b4f491de2863d622fbc03a9b4bcf5a63e625d519fb963" type="video/mp4"
poster="https://pikwizard.com/pw/medium/42c834ff0e18b64478d5fdebea61a562.jpg"/>
Your browser does not support the video tag.
</video>
<p style="font-size: 12px; margin: 0;">PikWizard</p>
</a>
</span>
</span>
Free (free of charge)
Free for personal and commercial use.
Author: Awesome Content